
Built by QuantSpark Labs
Global Healthcare SaaS Provider Achieves Unified BI for Strategic Growth
QuantSpark's Business Intelligence solution transformed a global healthcare SaaS provider's performance visibility, enabling data-driven decisions and unlocking growth potential across its portfolio.

Outcome delivered (no numeric metric supplied in source)
From no group-wide visibility to a single, real-time BI platform covering every business unit
- Timely, accurate, group-wide visibility into revenue retention, churn and sales metrics for the first time, letting leadership track core KPIs and spot areas of concern quickly
- Ability to evaluate the buy-and-build strategy unit by unit, identifying where to optimise and where to expand
- Robust revenue forecasting capability, supporting future exit planning
- A unified data warehouse and standardised reporting process established company-wide, providing the foundation for further advanced analytics
- A more consistent, well-organised data asset that makes growth drivers visible to prospective buyers, supporting company valuation
The problem
A healthcare software group built rapidly through acquisition found itself running the business blind. Recently bought by a UK private equity firm pursuing an aggressive buy-and-build strategy, the group had stitched several organisations together under one ownership structure, and the board urgently needed cross-portfolio visibility to manage what it now owned. It did not have it.
Each business unit operated its own billing system, its own contract structures and its own operational quirks. That fragmentation meant metrics could not be calculated consistently or compared across units, so there was no reliable, group-wide read on the numbers that matter most in a buy-and-build: revenue retention, churn and sales conversion.
The consequence went beyond day-to-day reporting friction. Without a centralised database and analytics platform, leadership could not benchmark business units against each other, could not see where the growth strategy was working and where it was not, and could not evidence the value creation a private equity owner needs to demonstrate, whether internally to its own leadership or, later, to a prospective buyer.
How we delivered it
Holistic assessment
QuantSpark began with a group-wide assessment covering every business unit: existing data sources, stakeholder needs, operational workflows and reporting requirements, mapped directly rather than assumed centrally.
BI roadmap development
A multi-phased BI roadmap was built on a data quality audit and reporting-suite wireframes, agreed with the board and leadership so the eventual dashboards would answer the questions those audiences actually had.
Scalable infrastructure deployment
QuantSpark's ProjectCube infrastructure was used to stand up a scalable data warehouse, with bespoke pipelines built to consolidate the group's various billing systems, CRMs and operational data sources into one unified data model.
Unified BI dashboards
On that single source of truth, QuantSpark built a suite of BI dashboards for cross-portfolio financial intelligence and growth analytics, giving real-time visibility into revenue retention, ARR, sales forecasting and customer segments.
Assess
Audit data sources, stakeholder needs and reporting requirements across every business unit
Design
Build the BI roadmap: data quality audit plus dashboard wireframes signed off by the board
Build
Stand up a warehouse on ProjectCube and pipe in billing, CRM and operational data from each unit
Deliver
Launch the unified BI dashboard suite: retention, churn, ARR, sales forecasting, segments, live group-wide
From siloed, unit-by-unit systems to one real-time BI platform for the whole group
Built with
ProjectCube (QuantSpark's data infrastructure accelerator)
Provided the ready-to-go foundation for standing up a scalable data warehouse quickly rather than building one from scratch
Bespoke data pipelines
Consolidated multiple per-unit billing systems, CRMs and operational data sources into a single unified data model
Unified data warehouse
Acted as the single source of truth underpinning all subsequent reporting
BI dashboard suite
Delivered real-time, cross-portfolio visibility into financial and growth KPIs to the board and leadership
Return on investment
Method, not a banked figureFrom no group-wide visibility to a single, real-time BI platform covering every business unit
Outcome delivered (no numeric metric supplied in source)
What was delivered
- Timely, accurate, group-wide visibility into revenue retention, churn and sales metrics for the first time, letting leadership track core KPIs and spot areas of concern quickly
- Ability to evaluate the buy-and-build strategy unit by unit, identifying where to optimise and where to expand
- Robust revenue forecasting capability, supporting future exit planning
- A unified data warehouse and standardised reporting process established company-wide, providing the foundation for further advanced analytics
- A more consistent, well-organised data asset that makes growth drivers visible to prospective buyers, supporting company valuation
How a return would be measured
The source does not quantify a pound value, a percentage improvement, or a time saving, so none is stated here. For engagements of this shape, the credible ROI story is qualitative rather than a single number: consistent, board-ready reporting replacing manual, unit-by-unit reconciliation; faster, more confident strategic decisions because retention, churn and sales metrics are visible group-wide rather than trapped in separate systems; and, longer term, a cleaner data asset that a buyer can diligence quickly, which private equity owners typically expect to support (without QuantSpark claiming to move) the eventual exit valuation.
A healthcare software group built rapidly through acquisition found itself running the business blind. QuantSpark's answer was a single, real-time business intelligence platform that gave the board its first group-wide view of revenue retention, churn, sales conversion and annual recurring revenue, and turned a scattered set of systems into a coherent data asset supporting the group's growth and eventual exit story.
The client is a global healthcare SaaS provider recently acquired by a UK private equity firm pursuing an aggressive buy-and-build strategy. Having stitched several organisations together under one ownership structure, the board urgently needed cross-portfolio visibility to manage what it now owned. It did not have it. Each business unit ran its own billing system, its own contract structures and its own operational quirks, so metrics could not be calculated consistently or compared across the group. Without a centralised database and analytics platform, leadership had no reliable read on the numbers that matter most in a buy-and-build: retention, churn, sales conversion. That mattered beyond reporting friction. Centralising disparate data sources into one BI solution was the precondition for benchmarking units against each other and for evidencing the value creation a private equity owner needs to show, whether internally to its own leadership or, eventually, to a buyer.
QuantSpark's response followed four stages. First, a holistic assessment across every business unit: existing data sources, stakeholder needs, operational workflows and reporting requirements, mapped directly rather than assumed centrally. Second, a multi-phased BI roadmap built on a data quality audit and reporting-suite wireframes, agreed with the board and leadership so the eventual dashboards would answer the questions those audiences actually had. Third, scalable infrastructure: QuantSpark's own ProjectCube accelerator was used to stand up a data warehouse quickly, with bespoke pipelines built to consolidate the group's various billing systems, CRMs and operational data sources into one unified data model. Fourth, with that single source of truth in place, QuantSpark built a suite of BI dashboards for cross-portfolio financial intelligence and growth analytics, covering revenue retention, ARR, sales forecasting and customer segments in real time.
The workflow reads cleanly left to right: assess the fragmented estate, design a roadmap the board has signed off, build a warehouse and pipelines on ProjectCube, then deliver a live dashboard suite. Underneath it sit four categorical layers of technology: the ProjectCube accelerator as the infrastructure foundation, bespoke data pipelines doing the consolidation work, a unified data warehouse as the single source of truth, and a BI dashboard layer as the visible product the board and leadership actually use day to day.
The value delivered is described in the source in qualitative terms rather than a single headline number. For the first time, leadership had timely, accurate visibility into revenue retention, churn and sales metrics across the whole group, letting them track progress against core KPIs and flag concerns quickly rather than discovering them late. That visibility let the client assess its buy-and-build strategy unit by unit, working out where to double down and where to intervene. The BI solution also supported more robust revenue forecasting, which the source ties to future exit planning, and it established a unified data warehouse and standardised reporting process company-wide, laying a foundation for further analytics work. Notably, the source frames the resulting data consistency as a factor supporting company valuation, on the basis that a clean, well-organised data asset is easier for a prospective buyer to diligence and gives clearer sight of growth drivers.
No figure in the source quantifies any of this as a percentage, a pound saving or a time reduction, so none is invented here. The honest ROI story is qualitative: consistent, board-ready reporting replacing manual reconciliation across disconnected systems; faster, better-evidenced strategic decisions because retention, churn and sales performance are visible across the whole portfolio rather than trapped inside separate units; and, longer term, a data asset clean enough to support (not guarantee) the valuation story at exit. That is a meaningful transformation for a group that started with no group-wide visibility at all, even without a single number to headline it.
Figures are drawn from completed QuantSpark engagements. Clients are anonymised by agreement; on a call we will walk you through how each number was measured and, where the client has agreed, put you in touch with a reference.
Related case studies

An online marketplace platform
Customer segmentation analytics suite lifts conversion probability by 30%
A private-equity-backed SaaS business
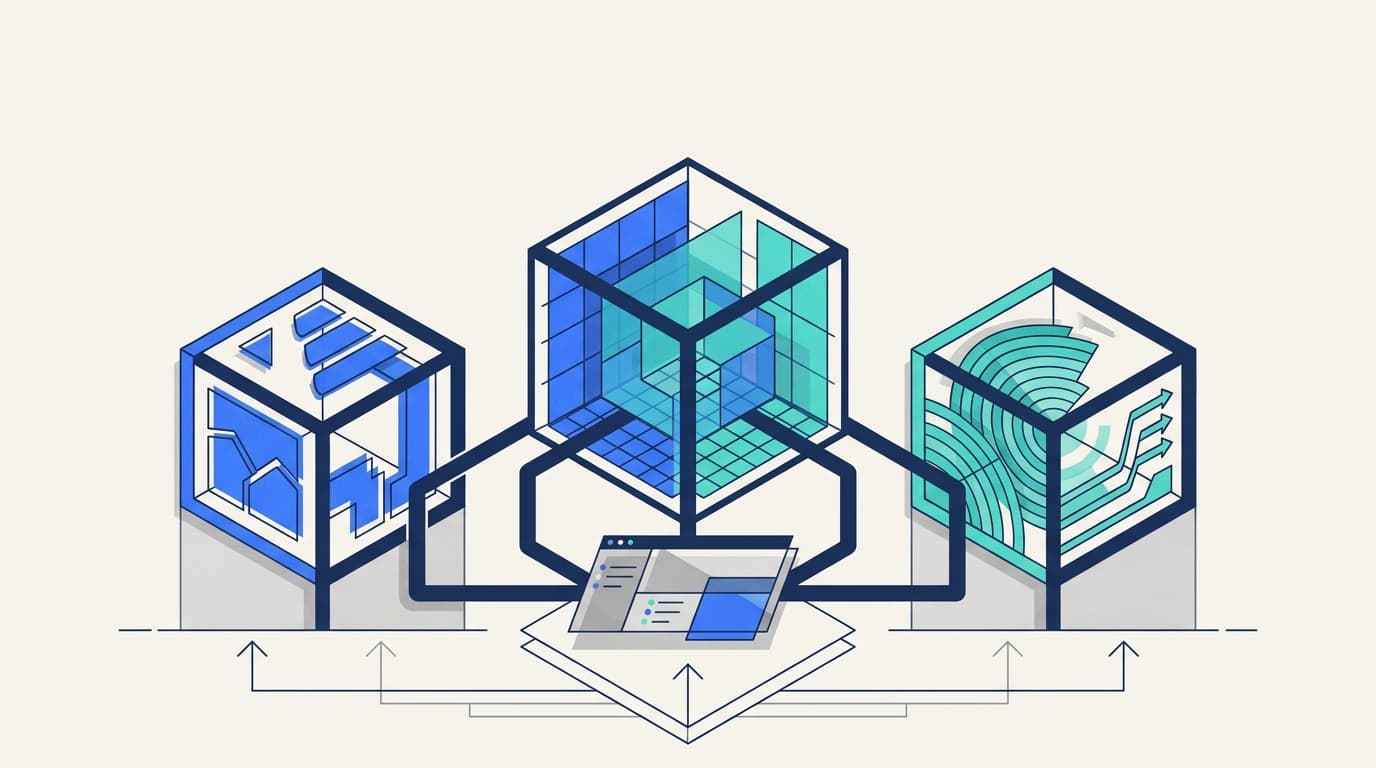
Building data cubes across subscriptions, usage and marketing for a SaaS business

A B2B switching service for energy, telecoms and insurance
Data engineering diagnostic and roadmap for a B2B switching service
Related insights

QuantSpark: Turning AI Ambition into Operational Reality for Private Equity
QuantSpark partners with private equity firms and their portfolio companies to deliver end-to-end AI transformation, combining strategy, AI, and software engineering to build high-ROI applications

Why FTSE 100 retailers are abandoning enterprise SaaS for custom AI
Off-the-shelf retail analytics is reaching the limits of what it can do for category leaders. Custom AI is starting to win, and the economics make sense.

How private equity firms source deals 3x faster with AI
Deal sourcing is mostly searching, reading, comparing and remembering. AI is good at all four. The PE firms that have figured this out are running circles around the ones that have not.
Ask about our work
Answers only from our documented case studies
Powered by the same applied-AI approach we deliver for clients
Solving something similar in SaaS & Tech?
Get in touch. We will discuss your challenge and show you what is possible.
Read more on AI for SaaS and technology