
Building data cubes across subscriptions, usage and marketing for a SaaS business
A private-equity-backed SaaS business gained a single view of subscriptions, product usage and marketing through three purpose-built data cubes and self-service dashboards.
Core delivered outcome (no numeric figure disclosed in source)
Board reporting moved from a manual, key-person-dependent process to an automated one
- Board reporting automated, which the client reports as saving significant analyst hours and removing the key-person risk of a manually compiled report
- Data access democratised across teams via self-service dashboards, rather than routed through an analyst
- High-value customers made identifiable through the marketing-attribution cube, giving a basis to prioritise acquisition spend
- Churn made identifiable and predictable through the product-usage cube, rather than discovered after the fact
- A measurable basis for return on investment created for the first time; the client expects this return to grow over time, which the source explicitly flags as a forward-looking projection rather than a delivered figure
The problem
The business held extensive product and customer data, but it sat in disconnected systems: marketing platforms, sales records and product-usage logs that never met in one place. Nobody could see, in a single view, which customers were most valuable, which marketing channels drove profitable growth, or which usage patterns preceded churn.
Board reporting was assembled by hand each cycle, a slow process that concentrated knowledge in whoever built the numbers and left the business exposed if that person left. The company wanted to democratise data access across teams and use it to sharpen acquisition, reduce churn and grow market share, but without a consolidated data layer that ambition had nowhere to run.
How we delivered it
Discovery
Mapped the client's existing data infrastructure: what was collected, where it lived and in what form, across marketing, sales and product systems.
Data modelling
Relationalised data held in non-relational stores into structures that could support consistent, repeatable reporting and analysis.
Data engineering
Built a cost-effective cloud storage environment and a pipeline connecting the client's digital-advertising and web-analytics platforms into the same data environment as subscription and product data.
Tooling choice
Used an open-source SQL transformation tool to build and maintain the data layer, keeping ongoing cost and maintenance low.
Cube construction
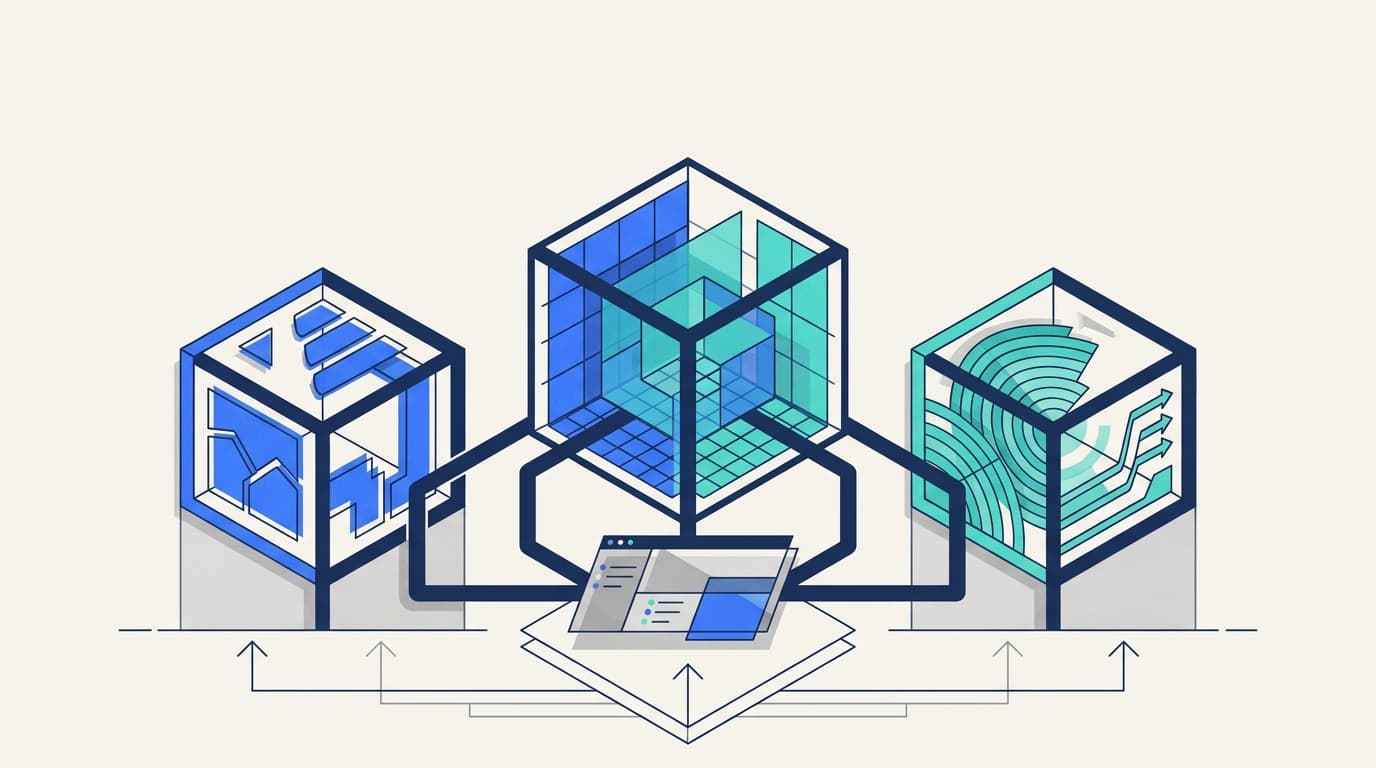
Built three purpose-built data cubes: subscriptions and contracts, product usage, and marketing attribution.
Dashboarding
Delivered a suite of self-service dashboards so finance, product and marketing teams could each query the data relevant to them directly.
Discovery & modelling
Map existing infrastructure; relationalise non-relational data
Data engineering
Cloud storage environment plus a pipeline from advertising and web-analytics platforms
Three data cubes
Subscriptions & contracts, product usage, marketing attribution
Self-service dashboards
Automated board reporting and direct team access to the data
From scattered source systems to a single, self-service view: discovery and modelling fed a cost-effective data-engineering layer, which powered three purpose-built cubes surfaced through self-service dashboards.
Built with
Cloud data storage environment
Central, cost-effective store for the modelled subscription, usage and marketing data
Open-source SQL transformation tool
Builds and maintains the data layer feeding the cubes, chosen to keep cost and maintenance low
Digital advertising and web-analytics platforms
Source systems feeding the marketing-attribution pipeline
Self-service dashboards
Distribution layer giving finance, product and marketing teams direct access, and automating board reporting
Return on investment
Method, not a banked figureBoard reporting moved from a manual, key-person-dependent process to an automated one
Core delivered outcome (no numeric figure disclosed in source)
What was delivered
- Board reporting automated, which the client reports as saving significant analyst hours and removing the key-person risk of a manually compiled report
- Data access democratised across teams via self-service dashboards, rather than routed through an analyst
- High-value customers made identifiable through the marketing-attribution cube, giving a basis to prioritise acquisition spend
- Churn made identifiable and predictable through the product-usage cube, rather than discovered after the fact
- A measurable basis for return on investment created for the first time; the client expects this return to grow over time, which the source explicitly flags as a forward-looking projection rather than a delivered figure
How a return would be measured
No monetary figure or percentage is given in the source, so no single ROI number can be stated. The value is best understood as three qualitative levers: time saved on manual board-report compilation (fewer recurring analyst-hours), reduced key-person risk (reporting no longer depends on one individual's institutional knowledge), and better-targeted spend (the marketing-attribution cube lets the business direct acquisition spend towards the customers and channels it shows to be most profitable). The client's own assessment treats the resulting return as cumulative rather than one-off, which is why it is reported here as an expectation rather than a realised saving.
A private-equity-backed software-as-a-service business asked QuantSpark to solve a familiar problem: plenty of data, no shared picture of it. The result was three purpose-built data cubes and a suite of self-service dashboards that replaced manual board reporting with an automated, always-current view of subscriptions, product usage and marketing performance. Board reporting is now automated rather than manually compiled, the process no longer depends on one person's institutional knowledge, and teams across the business can query the same numbers themselves instead of waiting on an analyst.
The problem QuantSpark was brought in to fix was not a shortage of data. The business held extensive product and customer information, but it sat in disconnected systems: marketing platforms, sales records and product-usage logs that never met in one place. Nobody could see, in one view, which customers were the most valuable, which marketing channels actually drove profitable growth, or which usage patterns preceded churn. Board reporting was assembled by hand each cycle, a slow process that concentrated knowledge in whoever built the numbers and left the business exposed if that person left. The company wanted to democratise data access across teams and use it to sharpen acquisition, cut churn and grow market share, but without a consolidated data layer that ambition had nowhere to run.
QuantSpark's response was to build the data layer first and the analysis on top of it. The engagement started with a discovery phase mapping the client's existing data infrastructure: what was collected, where it lived and in what form. Much of it sat in non-relational stores unsuited to the cross-cutting reporting the board and product teams needed, so the next step was data modelling, relationalising that data into structures that could support consistent, repeatable analysis. QuantSpark then built the underlying data engineering: a cost-effective cloud storage environment and a pipeline connecting the client's digital-advertising and web-analytics platforms, so marketing performance data could flow into the same environment as subscription and product data. An open-source SQL transformation tool sat at the centre of the build, chosen specifically to keep the ongoing cost and maintenance burden low.
On top of that foundation, QuantSpark built three data cubes, each answering a question the business had previously had to answer by instinct. A subscriptions-and-contracts cube gave finance and the board a reliable, automated source for financial reporting. A product-usage cube gave the business a way to identify and predict churn from behavioural signals rather than after the fact. A marketing-attribution cube let the business see which customers were most profitable and which channels were actually delivering them, rather than relying on guesswork. Self-service dashboards sat on top of all three, so finance, product and marketing teams could each interrogate the data relevant to them without raising a ticket with an analyst.
The system in place today is best understood as three layers working together: a cloud data-storage environment holding the modelled data, an open-source SQL transformation tool doing the build and maintenance work in between, and a pipeline drawing in data from the client's digital-advertising and web-analytics platforms, all surfaced through self-service dashboards for finance, product and marketing.
The value delivered splits into two kinds. The first is already realised: board reporting is automated, which the client reports as saving significant analyst hours and removing the key-person risk that came with a manually compiled report, and data access is genuinely democratised, with teams pulling their own numbers instead of queuing behind an analyst. The second is a foundation rather than a finished number: the marketing-attribution and product-usage cubes give the business, for the first time, a measurable basis for calculating return on the customers it acquires and retains, by making high-value customers and churn signals visible rather than invisible. The client itself frames this second category as a return that will grow over time, a forward-looking expectation rather than an audited figure, and this case is reported on that honest basis rather than converted into a number the source does not provide.
Figures are drawn from completed QuantSpark engagements. Clients are anonymised by agreement; on a call we will walk you through how each number was measured and, where the client has agreed, put you in touch with a reference.
This engagement drew on several of our practices
Decision analytics
Analytics-driven products and internal tools that put a decision in front of the person making it.
Typical engagement: 4 to 8 weeks, 1 engineer, fixed scope.
See the serviceData platform builds
Modern data stack implementations: ingestion, warehouse, transformation, BI.
Typical engagement: 12 to 20 weeks, 2 to 3 engineers, milestone-based pricing.
See the serviceRelated case studies

A high-growth cloud software (SaaS) provider
Automating business intelligence to prioritise sales leads in real time

Private equity-backed cyber security software provider
Real-time dashboards to evaluate a churn prediction model

An online automobile-trading platform
A cloud data lakehouse for an online vehicle-trading platform
Related insights

How AI Coding Assistants are Transforming Software Development: Power, Potential, and Best Practices
AI coding assistants like GitHub Copilot are reshaping software development, enabling faster prototyping and creative problem-solving. While powerful, thoughtful deployment with clear best practices…

The Brunelleschi Lesson: Why Operational AI Demands Both Human Ingenuity and Structural Rigour
Successfully implementing enterprise AI requires a dual focus: engaged human ingenuity and robust data infrastructure. Neglecting either side leads to underperformance, a lesson discernible from historical breakthroughs in art and science.

QuantSpark: Turning AI Ambition into Operational Reality for Private Equity
QuantSpark partners with private equity firms and their portfolio companies to deliver end-to-end AI transformation, combining strategy, AI, and software engineering to build high-ROI applications
Ask about our work
Answers only from our documented case studies
Powered by the same applied-AI approach we deliver for clients
Solving something similar in SaaS & Tech?
Get in touch. We will discuss your challenge and show you what is possible.
Read more on AI for SaaS and technology