
Real-time dashboards to evaluate a churn prediction model
A cyber security software provider needed to know whether its churn and downsell prediction model was working in production. QuantSpark built a dashboard suite that replaced slow, ad-hoc analysis with real-time visibility for the board.
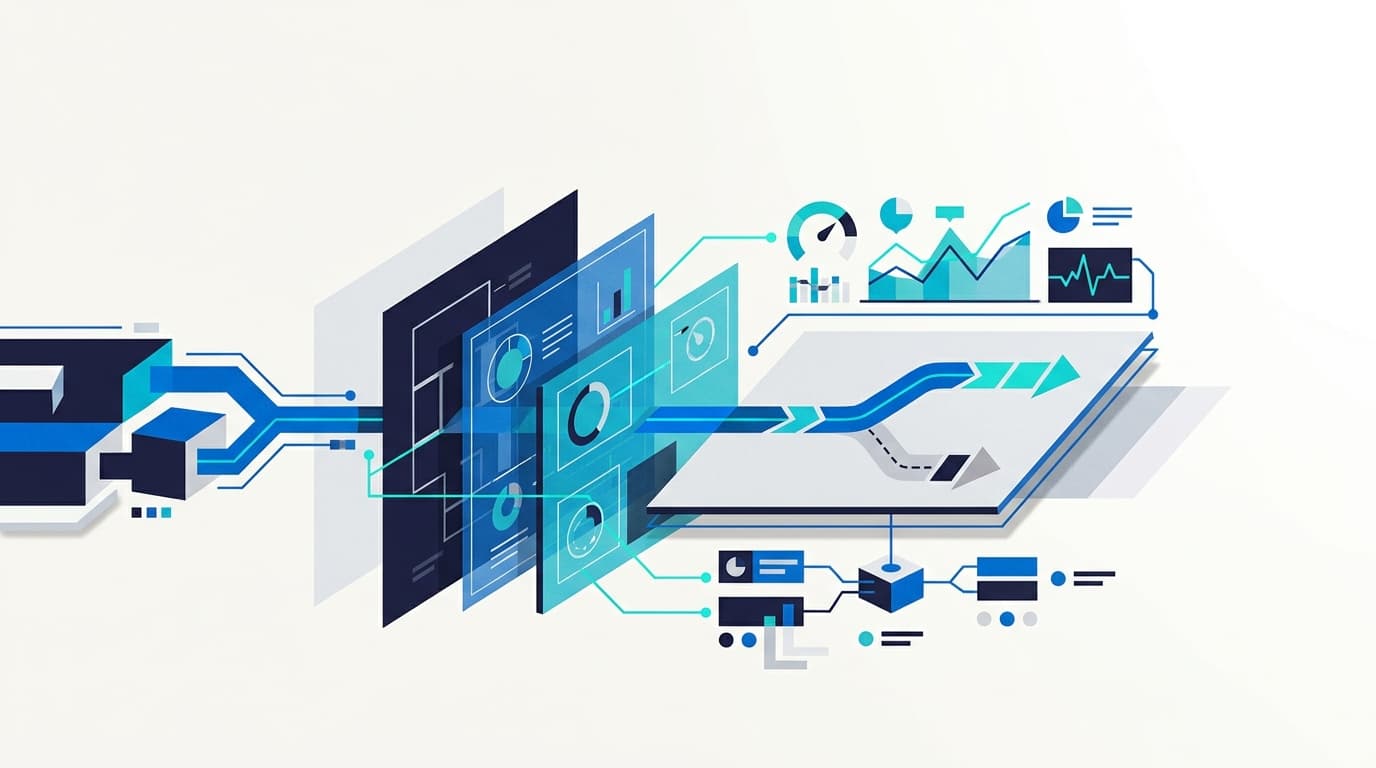
model-performance reporting for the board and senior management
Ad-hoc to real-time
- Gave the board and senior management real-time answers on model performance, replacing the ad-hoc analysis that had previously consumed analyst time
- Surfaced where the churn and downsell model was succeeding and where it needed improvement, by region and by customer segment
- Made visible whether customer-success engagement was concentrated on the accounts the model flagged as highest risk
- Paired every dashboard view with a recommended call to action, turning a reporting tool into a governance tool
The problem
The company's churn and downsell prediction model was already live and generating risk scores in production, but the reporting built around it had not kept pace with the deployment. Whenever the board or the C-suite wanted to know how well the model was performing, whether that performance held up across business units and customer segments, or whether the customer-success team was actually engaging the accounts the model flagged as high risk, the only route to an answer was a bespoke, one-off analysis built from scratch each time.
That pattern is a familiar failure mode for models that reach production without persistent monitoring designed in from the start. A model's accuracy in testing says little about how it behaves once it is live across different regions, segments and shifting customer behaviour, and without instrumentation built for the purpose, every governance question becomes billable analyst time rather than a repeatable answer. For a board trying to hold a model accountable, that is a slow and expensive way to get comfortable, and it leaves the gap between deployment and evidence of impact open for as long as the ad-hoc pattern persists.
How we delivered it
Map the real questions
QuantSpark worked with the company's data science team and senior management to identify the actual business questions and user journeys the dashboards needed to answer, rather than starting from whatever data happened to be available.
Agree the metrics that mattered
Fixed the metrics for model governance: precision and recall over time, performance broken down by region and customer segment, and the underlying signals driving individual risk scores.
Engineer a reliable data layer
Used DBT and Snowflake to build well-structured, transformed tables from the raw model outputs and business data, creating a dependable foundation rather than reporting built directly on messy source tables.
Build the dashboard suite
Designed and built real-time dashboards on top of that data layer, covering model performance and its drivers, sliced by the regional and segment dimensions the business actually cared about.
Connect model output to customer-success action
Added a dedicated view tracking whether customer-success engagement was concentrated on the accounts the model flagged as highest risk, linking model output to the process meant to act on it.
Pair every view with a recommended action
Attached a recommended call to action to each dashboard view, so a governance question resolved not just in a number but in a next step, whether retraining part of the model or redirecting customer-success attention.
Discovery
Business questions and user journeys mapped with the data science team and senior management
Data engineering
DBT and Snowflake transform raw model outputs and business data into reliable tables
Dashboard build
Real-time views for precision/recall, region and segment performance, and risk-score signals
Governance in use
Board and senior management self-serve answers, each paired with a recommended call to action
From scattered ad-hoc requests to a single governed dashboard suite
Built with
Snowflake
Cloud data warehouse holding the model-output and business data underlying the dashboards
DBT (data build tool)
Data transformation layer used to engineer well-structured tables from raw model and business data
Real-time dashboarding layer
Presentation layer for the model-performance views; the specific BI tool is not named in the source
Return on investment
Method, not a banked figureAd-hoc to real-time
model-performance reporting for the board and senior management
What was delivered
- Gave the board and senior management real-time answers on model performance, replacing the ad-hoc analysis that had previously consumed analyst time
- Surfaced where the churn and downsell model was succeeding and where it needed improvement, by region and by customer segment
- Made visible whether customer-success engagement was concentrated on the accounts the model flagged as highest risk
- Paired every dashboard view with a recommended call to action, turning a reporting tool into a governance tool
How a return would be measured
The source does not report a quantified return, so no percentage or monetary figure can responsibly be attached to this project. The value is better understood as a shift in kind: a recurring cost, the analyst time spent answering the same category of board question about model performance over and over, replaced by a one-off build that pays that cost back on every future question. The honest way to size the return for a comparable business is to total the analyst hours spent on ad-hoc model-performance requests over a typical reporting cycle, and weigh that recurring cost against the one-off cost of building the equivalent dashboard suite, without assuming a specific hourly rate or request volume that the source does not supply.
A cyber security software provider had already solved the harder problem: it had a churn and downsell prediction model live in production. What it could not do was tell the board, with any confidence, whether that model actually worked. QuantSpark closed that gap with a suite of real-time dashboards, replacing slow, ad-hoc analysis with continuous visibility into the model's performance, and turning every governance question into a self-serve answer rather than a fresh data-science task.
The problem: a model in production, but no reliable way to see it working
The company's churn and downsell model was generating risk scores in the live environment, but the reporting around it had not kept pace with the deployment. Whenever the board or the C-suite wanted to know how well the model was performing, whether performance held up across business units and customer segments, or whether the customer-success team was actually engaging the accounts the model flagged as high risk, the only route to an answer was a bespoke analysis, built from scratch each time.
That pattern is a familiar failure mode for models that reach production without persistent monitoring built in from the start. A model's accuracy in testing says little about how it behaves once it is live across different regions, segments and shifting customer behaviour, and without instrumentation designed for the purpose, every governance question becomes billable analyst time rather than a repeatable answer. For a board trying to hold a model accountable, that is a slow and expensive way to get comfortable.
The approach: build the reporting the business actually needed, not the reporting the data allowed
QuantSpark started with the questions rather than the data. Working with the company's data science team and senior management, the team mapped the business questions and user journeys the dashboards actually needed to answer, then agreed the metrics that mattered: precision and recall over time, performance broken down by region and customer segment, and the underlying signals driving individual risk scores.
With those requirements fixed, QuantSpark used DBT and Snowflake to engineer a set of well-structured data tables from the raw model outputs and business data, creating a dependable foundation to build on rather than reporting built directly on messy source tables. On top of that data layer, the team designed and built the dashboard suite itself: real-time views of model performance and its drivers, sliced by the dimensions that mattered to the business, plus a dedicated view tracking whether customer-success engagement was actually concentrated on the highest-risk accounts, connecting the model's output to the process meant to act on it.
The final design choice was the one that made the dashboards a governance tool rather than a reporting tool: every view was paired with a recommended call to action, so a question about model performance resolved not just in a number but in a next step, whether that meant retraining a segment of the model or redirecting customer-success attention.
The result: real-time answers, not ad-hoc analysis
The dashboard suite gave the board and senior management real-time answers to questions that had previously required repeated, time-consuming ad-hoc work, freeing analyst time for improving the model rather than re-proving it every time someone asked a question about it. It surfaced where the model was succeeding and where it needed improvement, by region and by customer segment, and made visible whether the accounts the model flagged as highest risk were the accounts customer success was actually working.
The source does not report a quantified return, so no percentage or pound figure can responsibly be attached to this project. The value is better understood as a shift in kind: a recurring cost, the analyst time spent answering the same category of board question over and over, replaced by a one-off build that pays that cost back on every future question. For a business considering the same move, the honest way to size the return is to total the analyst hours spent on ad-hoc model-performance requests over a typical reporting cycle, and weigh that recurring cost against the cost of building the equivalent dashboard suite once.
The build sits on Snowflake as the data warehouse and DBT as the transformation layer, with a real-time dashboarding layer presenting the views; the source does not name the specific BI tool used for that presentation layer.
Figures are drawn from completed QuantSpark engagements. Clients are anonymised by agreement; on a call we will walk you through how each number was measured and, where the client has agreed, put you in touch with a reference.
This engagement drew on several of our practices
Data platform builds
Modern data stack implementations: ingestion, warehouse, transformation, BI.
Typical engagement: 12 to 20 weeks, 2 to 3 engineers, milestone-based pricing.
See the serviceDecision analytics
Analytics-driven products and internal tools that put a decision in front of the person making it.
Typical engagement: 4 to 8 weeks, 1 engineer, fixed scope.
See the serviceRelated case studies
A private-equity-backed SaaS business
Building data cubes across subscriptions, usage and marketing for a SaaS business

A high-growth cloud software (SaaS) provider
Automating business intelligence to prioritise sales leads in real time

An online marketplace platform
Customer segmentation analytics suite lifts conversion probability by 30%
Related insights

How AI Coding Assistants are Transforming Software Development: Power, Potential, and Best Practices
AI coding assistants like GitHub Copilot are reshaping software development, enabling faster prototyping and creative problem-solving. While powerful, thoughtful deployment with clear best practices…

The Brunelleschi Lesson: Why Operational AI Demands Both Human Ingenuity and Structural Rigour
Successfully implementing enterprise AI requires a dual focus: engaged human ingenuity and robust data infrastructure. Neglecting either side leads to underperformance, a lesson discernible from historical breakthroughs in art and science.

QuantSpark: Turning AI Ambition into Operational Reality for Private Equity
QuantSpark partners with private equity firms and their portfolio companies to deliver end-to-end AI transformation, combining strategy, AI, and software engineering to build high-ROI applications
Ask about our work
Answers only from our documented case studies
Powered by the same applied-AI approach we deliver for clients
Solving something similar in SaaS & Tech?
Get in touch. We will discuss your challenge and show you what is possible.
Read more on AI for SaaS and technology