
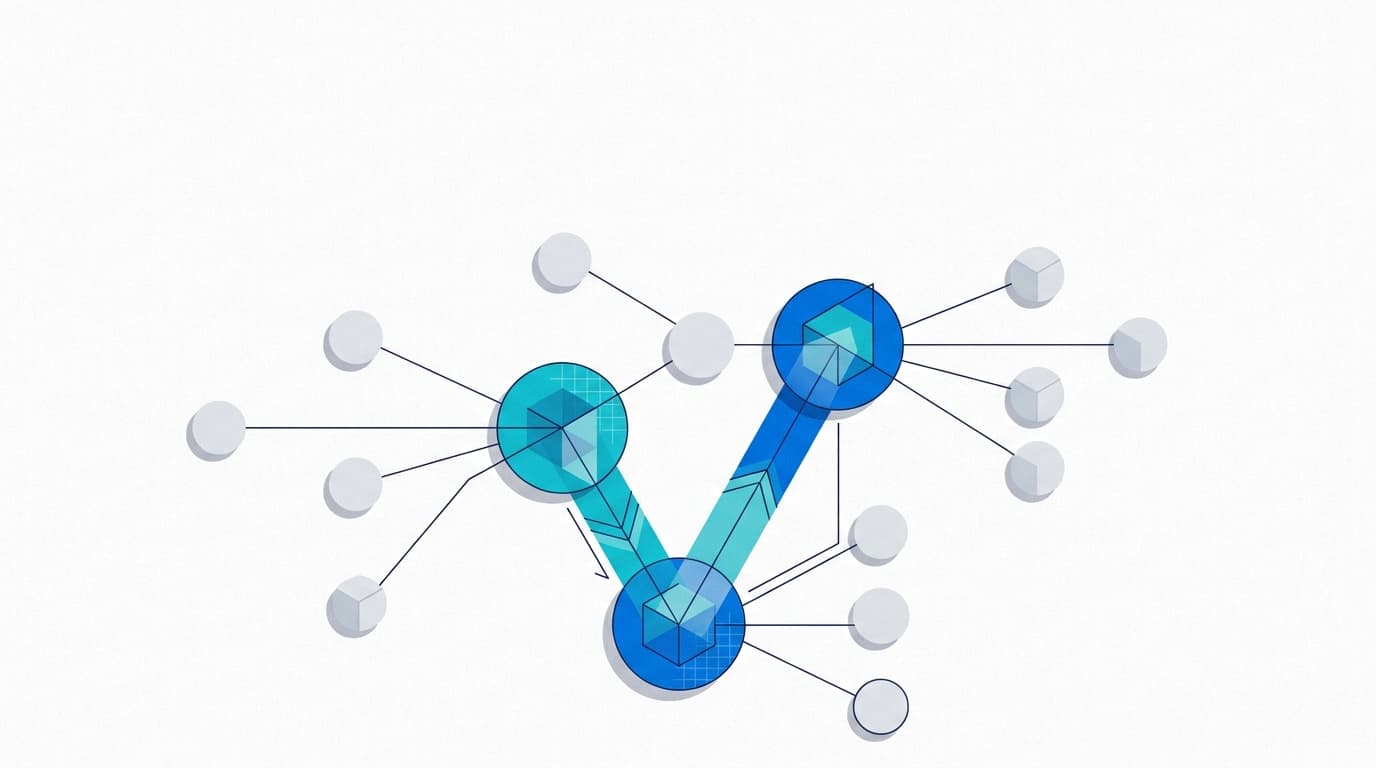
An interactive data cube supporting the sale of a SaaS business
Forensic revenue and churn analytics, delivered as interactive dashboards, withstood investor scrutiny and reinforced the valuation of a SaaS business during its sale.

Due-diligence outcome (no numeric uplift is disclosed in the public source)
Withstood full investor data-room scrutiny
- Dashboards became a critical component of the information memorandum used to market the business for sale
- Analysis withstood scrutiny inside the investor data room during buy-side due diligence
- Helped reinforce an attractive valuation for the business, though no specific uplift figure is disclosed
- Client retained the dashboards after the sale to monitor business health and inform day-to-day decisions
The problem
A private-equity-backed software-as-a-service business was heading into vendor due diligence ahead of a sale, and needed a robust, defensible analysis of revenue and churn, including upsell, cross-sell and downsell, to support the process. In SaaS mergers and acquisitions, valuation hinges less on top-line revenue than on the quality of that revenue: how much comes from existing customers spending more, how much is being lost to cancellations or shrinking contracts, and how durable the resulting net picture looks going forward.
These customer behaviours drive the multiple a buyer is prepared to pay, yet they are notoriously hard to extract cleanly from raw sales data. Transactional records show what happened to invoices and contracts, not the customer-level story behind them: which accounts expanded, which contracted, which churned, and why the net effect looks the way it does.
Left unresolved, that gap becomes a liability inside due diligence rather than a neutral unknown. A vendor who cannot show clear, reproducible workings on churn and expansion invites buy-side advisers to assume the worst, discount the price, or use the ambiguity as a negotiating lever during the data-room process. The analysis needed to be robust enough not just for internal reporting, but to withstand direct interrogation by investors and their advisers scrutinising the deal.
How we delivered it
Clean and standardise the raw sales data
Built repeatable data-engineering workflows to clean and transform the underlying transactional sales data, resolving inconsistencies so that customer-level behaviour could be tracked reliably across the historical dataset.
Define a consistent metrics logic framework
Developed a logic framework that defined churn, upsell, cross-sell and downsell precisely and consistently, so that the resulting figures would be reproducible and defensible under scrutiny rather than dependent on manual, one-off calculation.
Automate the metric calculations
Automated the calculation of churn, upsell and cross-sell metrics against the cleaned dataset, removing manual recalculation as a source of error or inconsistency each time the numbers needed refreshing.
Build a suite of interactive dashboards
Visualised business performance and customer behaviour in a suite of interactive dashboards, translating the underlying metrics into a form usable by the client's team and, ultimately, by external advisers and investors.
Deploy the analysis into the deal process
The dashboards were incorporated into the information memorandum used to market the business and were put in front of investors and their advisers inside the data room, where they had to hold up under direct questioning.
Hand over for ongoing use
Beyond the sale process, the client retained the dashboards as a standing tool to monitor business health and inform day-to-day decisions, rather than treating the analysis as a one-off deliverable for the transaction.
Raw sales data
Disparate transactional records with no reliable view of churn or expansion
Clean and transform
Repeatable data-engineering workflows standardise the underlying data
Metrics logic framework
Churn, upsell, cross-sell and downsell defined and automated consistently
Interactive dashboards
Business performance and customer behaviour visualised for internal and external use
Investor data room
Analysis incorporated into the information memorandum and stress-tested by buy-side scrutiny
Retained post-sale
Client keeps the dashboards to monitor business health and inform ongoing decisions
From raw sales data to a due-diligence-ready analytical asset retained after sale
Built with
Data transformation / ETL pipeline
Cleaned and standardised raw, disparate sales data into a consistent base for behavioural analysis
Metrics logic layer
Encoded consistent, repeatable definitions of churn, upsell, cross-sell and downsell and automated their calculation
Interactive dashboard / BI layer
Presented business performance and customer behaviour to the client team, and later to investors and advisers in the data room
Return on investment
Method, not a banked figureWithstood full investor data-room scrutiny
Due-diligence outcome (no numeric uplift is disclosed in the public source)
What was delivered
- Dashboards became a critical component of the information memorandum used to market the business for sale
- Analysis withstood scrutiny inside the investor data room during buy-side due diligence
- Helped reinforce an attractive valuation for the business, though no specific uplift figure is disclosed
- Client retained the dashboards after the sale to monitor business health and inform day-to-day decisions
How a return would be measured
SaaS valuations are highly sensitive to demonstrated net revenue retention: credible, granular churn, upsell, cross-sell and downsell analysis reduces perceived risk for a buyer and can support a smoother deal process with fewer information-asymmetry challenges from bidders' advisers. The public source discloses no specific pound value, percentage uplift or valuation multiple, so none is stated here. The value is evidenced through use, namely inclusion in the information memorandum and survival of data-room scrutiny, rather than through a quantified financial return.
A private-equity-backed software-as-a-service business took a set of QuantSpark-built analytics dashboards into its own sale process, and used them to help reinforce an attractive valuation. Built to make sense of churn, upsell, cross-sell and downsell behaviour buried in the company's raw sales data, the dashboards became a working part of the information memorandum used to market the business, held up under scrutiny inside the investor data room, and continue in daily use by the client to monitor business health. That is the headline worth leading with: not a percentage or a pound figure, since none is disclosed publicly, but a due-diligence outcome that speaks for itself. Credible revenue-quality evidence survived one of the hardest audiences it could face: buyers' own advisers, whose job in a data room is to find reasons to mark the price down.
The problem QuantSpark was brought in to solve is a familiar one in SaaS mergers and acquisitions. Valuation in this sector hinges less on top-line revenue than on the quality of that revenue: how much comes from existing customers spending more, how much is being lost to cancellations or shrinking contracts, and how durable the resulting net picture looks going forward. These customer behaviours drive the multiple a buyer is prepared to pay, yet they are notoriously hard to extract cleanly from raw sales data. Transactional records show what happened to invoices and contracts, not the customer-level story behind them. Left unresolved, that gap becomes a liability inside due diligence rather than a neutral unknown: a vendor who cannot show clear, reproducible workings on churn and expansion invites buy-side advisers to assume the worst, discount the price, or use the ambiguity as a negotiating lever.
QuantSpark's response was to turn ambiguous transactional history into a defensible, repeatable analytical asset, built in a clear sequence. The first step was data engineering: building repeatable workflows to clean and transform the raw sales data, resolving inconsistencies so that customer-level behaviour could be tracked reliably across the historical dataset. On top of that clean base, the team developed a logic framework that defined churn, upsell, cross-sell and downsell precisely and consistently, so that the figures produced would be reproducible under scrutiny rather than dependent on manual, one-off calculation. That framework was then automated, removing manual recalculation as a source of error or inconsistency each time the numbers needed refreshing. Finally, the metrics were visualised in a suite of interactive dashboards, translating the underlying analysis into a form usable first by the client's own team, and ultimately by external advisers and investors examining the deal.
The workflow this created runs cleanly from one end to the other: raw, disparate sales data goes in; standardised data-engineering workflows clean and transform it; a consistent metrics logic layer defines and automates churn, upsell, cross-sell and downsell; interactive dashboards present the results; and those dashboards then do double duty, first inside the information memorandum and investor data room during the sale process, and afterwards as a retained tool for ongoing business monitoring. Three categorical layers of system sit behind that flow: a data-transformation pipeline for cleaning and standardising the source data, a metrics logic layer encoding consistent behavioural definitions, and a dashboard or BI layer for presentation. No specific product names are attached to any of these in the public account, so they are described here only in categorical terms.
The value delivered is real but is evidenced qualitatively rather than through a disclosed number. The dashboards became a critical component of the information memorandum, they withstood scrutiny inside the investor data room, and they are credited with helping to reinforce an attractive valuation for the business, though no specific uplift, percentage or multiple is stated anywhere in the source. That absence is worth being explicit about rather than papering over: SaaS valuations are sensitive to demonstrated net revenue retention, and credible, granular analysis of this kind reduces a buyer's perceived risk and can smooth a deal process by giving bidders' advisers fewer grounds to challenge the numbers. But translating that dynamic into a specific pound saving or percentage would mean inventing a figure that was never disclosed, which this account deliberately avoids.
What has lasted beyond the sale process is itself a signal of the analysis's quality. Rather than being treated as a one-off deliverable for the transaction, the dashboards were retained by the client as a standing tool, used day to day to monitor business health and inform decisions. An analytical asset built to survive one of the most adversarial audiences it could face, a buyer's own due-diligence team, and then retained for ongoing use afterwards, is a stronger proof point than any single number could offer on its own.
Figures are drawn from completed QuantSpark engagements. Clients are anonymised by agreement; on a call we will walk you through how each number was measured and, where the client has agreed, put you in touch with a reference.
This engagement drew on several of our practices
Data platform builds
Modern data stack implementations: ingestion, warehouse, transformation, BI.
Typical engagement: 12 to 20 weeks, 2 to 3 engineers, milestone-based pricing.
See the serviceDecision analytics
Analytics-driven products and internal tools that put a decision in front of the person making it.
Typical engagement: 4 to 8 weeks, 1 engineer, fixed scope.
See the serviceRelated case studies

Chronograph
Building a private equity value-creation data stack with Chronograph
A leading European software-focused private equity investor
A repeatable data-science playbook across a private equity portfolio

A mid-market private equity firm
DataControl Platform: intelligent private equity data management
Related insights

How AI Coding Assistants are Transforming Software Development: Power, Potential, and Best Practices
AI coding assistants like GitHub Copilot are reshaping software development, enabling faster prototyping and creative problem-solving. While powerful, thoughtful deployment with clear best practices…

The Brunelleschi Lesson: Why Operational AI Demands Both Human Ingenuity and Structural Rigour
Successfully implementing enterprise AI requires a dual focus: engaged human ingenuity and robust data infrastructure. Neglecting either side leads to underperformance, a lesson discernible from historical breakthroughs in art and science.

QuantSpark: Turning AI Ambition into Operational Reality for Private Equity
QuantSpark partners with private equity firms and their portfolio companies to deliver end-to-end AI transformation, combining strategy, AI, and software engineering to build high-ROI applications
Ask about our work
Answers only from our documented case studies
Powered by the same applied-AI approach we deliver for clients
Solving something similar in Private Equity?
Get in touch. We will discuss your challenge and show you what is possible.
Read more on AI for private equity