
Building a private equity value-creation data stack with Chronograph
Returns now come from inside the portfolio company, not from cheap leverage. QuantSpark and Chronograph built a three-stage data stack that compresses portfolio monitoring from days to minutes and gives deal teams one live source of truth for every KPI.
- Days to minutes
- Portfolio monitoring cycle
- Three-stage programme
- Engagement length
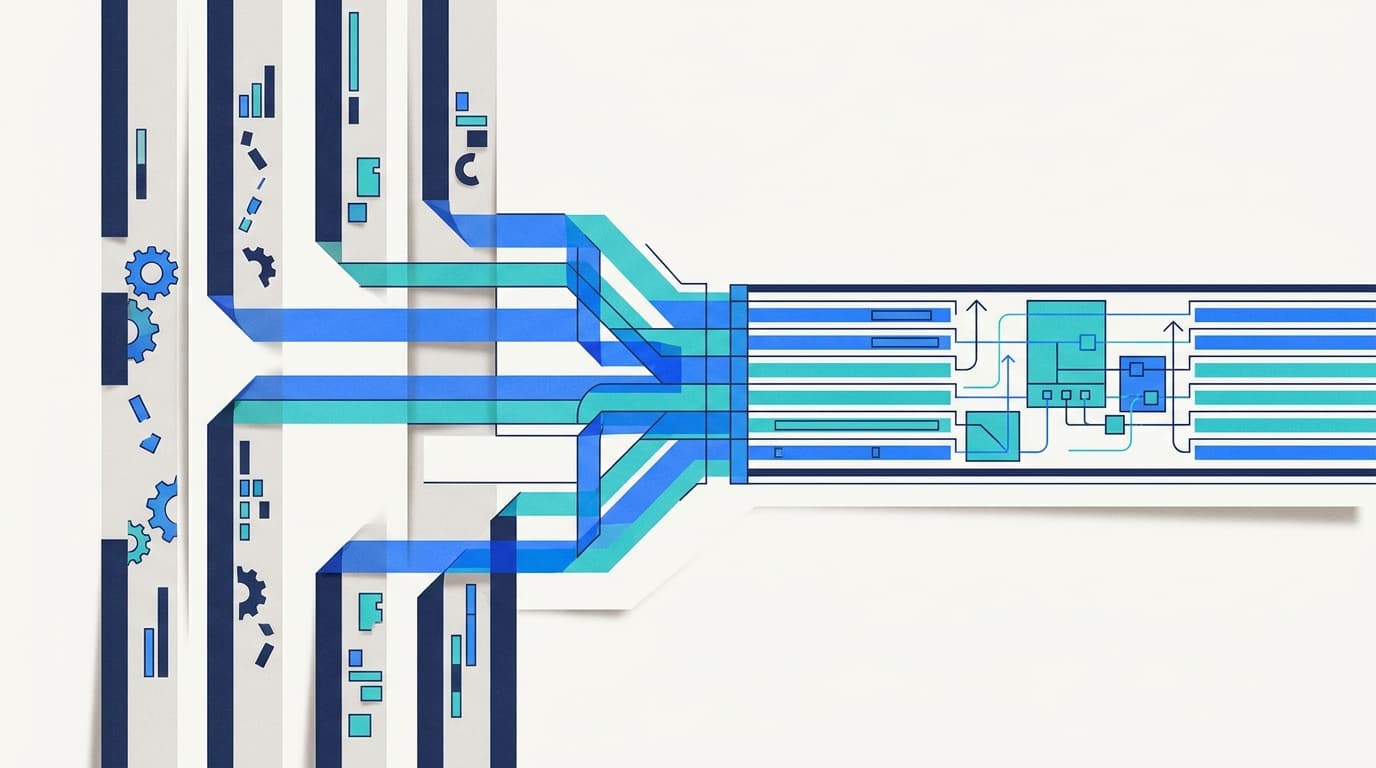
Portfolio monitoring cycle
Days to minutes
- Monitoring cycles compressed from days to minutes, freeing operating teams to spend time on value levers rather than on the spreadsheet
- One source of truth: every KPI live, with the fund's monitoring platform and market data joined for the first time
- Cross-portfolio intelligence: patterns previously invisible across silos now surface in plain sight, so the fund can act on them across the whole book
The problem
A decade of cheap money let mediocre assets pass for winners. That era is over: rates are higher, growth is slower, and returns now have to come from inside the portfolio company rather than from leverage. Value creation has become the whole of the game, not a bonus on top of it.
The trouble is that the operating model has not caught up with the investment thesis. Portfolio monitoring across the industry is still stitched together with duct-tape integrations, a red flag on every joint, and numbers that arrive well after the question was asked.
Three symptoms recur in almost every fund. KPIs are lifted out of Excel by hand, an analyst's cursor doing the work an API should do. Monitoring platforms do not talk to market data, so silos sit where a join should be. And a partner who needs an answer today can be told to wait two days, because the spreadsheet moves slower than the quarter does.
How we delivered it
Discovery workshops
Workshops map the fund end to end: its data estate, operating model, investment thesis and compliance posture, surfacing where KPIs actually live today.
Cloud plan tuned to the fund
A cloud infrastructure plan is built to the fund's specific size, geography and regulatory requirements, rather than applied as a generic template.
Automated pipeline build
Pipelines are built to pull Chronograph data, market benchmarks and the KPIs previously trapped in Excel into a single warehouse.
Scheduled refresh cadence
Data refreshes on a set cadence rather than being rekeyed by an analyst each quarter.
Interactive dashboard design
Portfolio vitals, deal lifecycle and value-creation attribution are built into dashboards that sit on one screen.
Single source of truth rollout
The fund's monitoring platform and market data are joined for the first time, so every team works from the same set of live numbers.
Discovery & mapping
Workshops map data estate, operating model, investment thesis and compliance posture.
Cloud & pipeline build
Cloud plan tuned to the fund; pipelines pull Chronograph data, market benchmarks and Excel-trapped KPIs into one warehouse.
Scheduled refresh
Data refreshes on a set cadence instead of manual quarterly rekeying.
Interactive dashboards
Portfolio vitals, deal lifecycle and value-creation attribution surface on one screen.
One source of truth
Monitoring platform and market data joined live; monitoring cycle drops from days to minutes.
From fragmented, Excel-based reporting to a live single source of truth: how the value-creation data stack moves a fund from days to minutes.
Built with
Chronograph (portfolio monitoring platform)
Existing fund monitoring system integrated into the new data stack as the source of portfolio KPIs
Cloud data warehouse
Central store consolidating Chronograph data, market benchmarks and formerly Excel-based KPIs on a scheduled refresh
External market benchmark data feeds
Joined against portfolio KPIs to give value-creation attribution its market context
Interactive dashboard / BI layer
Surfaces portfolio vitals, deal lifecycle and value-creation attribution drawn from the single warehouse
Return on investment
Method, not a banked figureDays to minutes
Portfolio monitoring cycle
What was delivered
- Monitoring cycles compressed from days to minutes, freeing operating teams to spend time on value levers rather than on the spreadsheet
- One source of truth: every KPI live, with the fund's monitoring platform and market data joined for the first time
- Cross-portfolio intelligence: patterns previously invisible across silos now surface in plain sight, so the fund can act on them across the whole book
How a return would be measured
The source quotes no monetary saving, so none is presented here. The return is measured as decision-cycle compression: the time from a partner's question to a live answer, which the source describes falling from as much as two days (for an urgent query, against a backdrop of monitoring platforms that did not talk to market data) to minutes once the automated pipelines and dashboards were live. A fund wanting a pound-figure ROI would need to apply its own assumptions, for example partner or analyst hours reclaimed, or the value of faster identification of an underperforming KPI, to that time saving; QuantSpark's case study does not perform that conversion.
QuantSpark built a private equity value-creation data stack for Chronograph that took portfolio monitoring from a multi-day, spreadsheet-bound chase to a live, minutes-fast answer. Every KPI now sits on one screen, refreshed on a schedule, with the fund's monitoring platform and market data joined for the first time.
The problem: a new playbook running on old plumbing
A decade of cheap money let mediocre assets pass for winners. That era is over. Rates are higher, growth is slower, and returns now have to come from inside the portfolio company rather than from leverage. Value creation has become the whole of the game, not a bonus on top of it.
The trouble is that the operating model has not caught up with the investment thesis. Portfolio monitoring across the industry is still stitched together with duct-tape integrations, a red flag on every joint, and numbers that arrive well after the question was asked.
Three symptoms recur in almost every fund. KPIs are lifted out of Excel by hand, an analyst's cursor doing the work an API should do. Monitoring platforms do not talk to market data, so silos sit where a join should be. And a partner who needs an answer today can be told to wait two days, because the spreadsheet moves slower than the quarter does.
The approach: three stages, one warehouse
QuantSpark and Chronograph built the stack in three deliberate stages, moving from discovery to automation to a single interactive surface.
Workshops first mapped the fund end to end: its data estate, its operating model, its investment thesis and its compliance posture. From that map came a cloud plan tuned to the fund's size, geography and regulatory requirements, rather than a generic template applied regardless of fit.
With the foundations set, the team built automated pipelines that pull Chronograph data, market benchmarks and the KPIs previously trapped in Excel into a single warehouse, on a schedule rather than as a manual favour. Data now refreshes on a set cadence instead of being rekeyed every quarter.
The final stage put that consolidated data in front of the people who use it: interactive dashboards showing portfolio vitals, deal lifecycle and value-creation attribution on one screen, all drawing from the same set of numbers.
The workflow in practice
The sequence runs from mapping to monitoring. Discovery workshops establish the fund's data estate and constraints. A cloud plan is then tuned to the fund's specific footprint. Automated pipelines pull Chronograph data, market benchmarks and spreadsheet-bound KPIs into one warehouse. That warehouse refreshes on a set schedule rather than a manual quarterly rekey. Finally, dashboards surface portfolio vitals, deal lifecycle and value-creation attribution live, giving deal teams and operating partners one shared source of truth.
The systems behind it
The stack integrates with Chronograph, the fund's existing portfolio monitoring platform, and pulls in external market benchmark data alongside it. A cloud data warehouse consolidates everything on a schedule, and a dashboard layer turns that consolidated data into the portfolio vitals, deal lifecycle and value-creation views that operating teams and partners use day to day.
The value delivered
The headline change is cycle time: portfolio monitoring moved from days to minutes. That is not a marginal efficiency gain. It changes what operating teams spend their time on: instead of chasing numbers through Excel, they spend it on the value levers the fund is actually trying to pull.
Two further results matter alongside the speed. First, there is now one source of truth: every KPI live, with the monitoring platform and market data joined for the first time rather than sitting in separate silos. Second, that join surfaces cross-portfolio intelligence. Patterns that used to be invisible across individual companies now show up in plain sight, so the fund can act on them across the whole book, not just deal by deal.
No monetary figure is quoted for this engagement, so none should be inferred here. The honest way to read the return is as a decision-cycle measurement: how long it takes from a partner's question to a live answer, which fell from days (as much as two, on the source's own account, for an urgent query) to minutes once the automated pipelines and dashboards were live. A fund wanting to translate that into pounds, whether through partner hours reclaimed or faster identification of an underperforming asset, would need to apply its own salary and deal-value assumptions. QuantSpark's case study does not perform that calculation for them.
Figures are drawn from completed QuantSpark engagements. Clients are anonymised by agreement; on a call we will walk you through how each number was measured and, where the client has agreed, put you in touch with a reference.
This engagement drew on several of our practices
Data platform builds
Modern data stack implementations: ingestion, warehouse, transformation, BI.
Typical engagement: 12 to 20 weeks, 2 to 3 engineers, milestone-based pricing.
See the serviceDecision analytics
Analytics-driven products and internal tools that put a decision in front of the person making it.
Typical engagement: 4 to 8 weeks, 1 engineer, fixed scope.
See the serviceRelated case studies

A mid-market private equity firm
DataControl Platform: intelligent private equity data management
A private-equity-backed SaaS business
An interactive data cube supporting the sale of a SaaS business
A leading European software-focused private equity investor
A repeatable data-science playbook across a private equity portfolio
Related insights

How AI Coding Assistants are Transforming Software Development: Power, Potential, and Best Practices
AI coding assistants like GitHub Copilot are reshaping software development, enabling faster prototyping and creative problem-solving. While powerful, thoughtful deployment with clear best practices…

The Brunelleschi Lesson: Why Operational AI Demands Both Human Ingenuity and Structural Rigour
Successfully implementing enterprise AI requires a dual focus: engaged human ingenuity and robust data infrastructure. Neglecting either side leads to underperformance, a lesson discernible from historical breakthroughs in art and science.

QuantSpark: Turning AI Ambition into Operational Reality for Private Equity
QuantSpark partners with private equity firms and their portfolio companies to deliver end-to-end AI transformation, combining strategy, AI, and software engineering to build high-ROI applications
Ask about our work
Answers only from our documented case studies
Powered by the same applied-AI approach we deliver for clients
Solving something similar in Private Equity?
Get in touch. We will discuss your challenge and show you what is possible.
Read more on AI for private equity