
Deploying advanced data engineering to accelerate investment data processing
How QuantSpark cut an asset manager's end-to-end investment-data processing time by 70%, giving portfolio managers faster access to the data behind their decisions.
- 70%
- reduction in data processing time

reduction in data processing time
70%
- End-to-end processing time cut from 5 days to 1.5 days, a 70% reduction
- The technical processing run itself cut from a few hours to under 30 minutes
- Faster, validated data freed up resource previously spent on manual collection and checking for higher-value work
- Portfolio managers gained the ability to act on consumer-spending signals sooner, closer to the point at which the data still carried a time advantage
The problem
The asset manager sourced near-real-time consumer-spending intelligence from a third-party provider: data drawn from card-purchase activity that is valuable to quantitative portfolio managers precisely because it moves faster than traditional economic indicators. But that speed advantage was being lost in the last mile. Collecting, cleaning and validating the data was a manual process, and by the time it reached portfolio managers it typically arrived several days after release.
A feed built to capture near-real-time consumer behaviour was reaching the desk too late to inform the time-sensitive, data-intensive decisions it existed to support. The bottleneck was not the underlying data but everything that happened to it between the provider and the portfolio manager: manual collection, manual cleaning, manual validation, each adding time before the signal could be trusted and used.
How we delivered it
Data audit
Mapped the existing manual workflow end to end, from data receipt through to delivery to portfolio managers, to pinpoint exactly where time was being lost and which steps genuinely needed to be manual versus which could be automated.
Automated pipeline build
Engineered a Python-based data pipeline to replace manual collection and cleaning, removing the repetitive human handling steps that were adding days to the cycle.
Cloud infrastructure, client-hosted
Built and deployed the pipeline inside the asset manager's own cloud environment, meeting the firm's security requirements without the data needing to leave their controlled infrastructure.
Direct dashboard integration
Connected the pipeline output straight into interactive dashboards for portfolio managers, removing the manual hand-off and formatting steps that previously sat between validated data and the people who needed it.
Automated quality assurance
Replaced ad hoc manual checking with automated checks and alerts, triggered whenever incoming source data fell outside expected thresholds, so validation happened continuously rather than as a separate manual stage.
Provider feed
Consumer-spending data arrives from the third-party provider.
Automated pipeline
Python-based, cloud-hosted pipeline ingests and cleans the data in place of manual handling.
Automated QA
Threshold-based checks and alerts flag any data falling outside expected ranges before it reaches users.
Interactive dashboard
Validated data lands directly in portfolio managers' dashboards, cutting the wait from days to hours.
From raw provider feed to portfolio-manager-ready dashboard: how the automated pipeline replaced a multi-day manual process with a monitored, near-continuous flow.
Built with
Python-based data pipeline
Automates ingestion, cleaning and transformation of provider data, replacing manual collection and cleaning steps.
Client-hosted cloud infrastructure
Runs the pipeline inside the asset manager's own environment to meet security requirements.
Interactive dashboarding layer
Surfaces validated data directly to portfolio managers, removing manual hand-off steps.
Automated QA and alerting layer
Continuously checks incoming data against expected thresholds and flags anomalies before delivery.
Return on investment
Delivered return70%
reduction in data processing time
What was delivered
- End-to-end processing time cut from 5 days to 1.5 days, a 70% reduction
- The technical processing run itself cut from a few hours to under 30 minutes
- Faster, validated data freed up resource previously spent on manual collection and checking for higher-value work
- Portfolio managers gained the ability to act on consumer-spending signals sooner, closer to the point at which the data still carried a time advantage
How the return was measured
The 70% figure is measured as the reduction in end-to-end processing time, from data receipt to a portfolio-manager-ready dashboard, and is reported alongside a separate, more dramatic improvement in the technical run time (a few hours to under 30 minutes), which isolates pure pipeline efficiency from the human review and hand-off steps either side of it. Converting time saved into a monetary return would require two inputs the public source does not disclose: the analyst hours previously absorbed by manual collection and validation, and the trading or decision value of receiving a time-sensitive signal days earlier. Without a stated day rate or valuation of decision speed, the responsible claim is the one QuantSpark itself makes: time saved and capacity freed, not a derived pound figure.
QuantSpark cut an asset manager's end-to-end investment-data processing time by 70%, compressing a workflow that used to take five days down to a day and a half, and shrinking the technical processing run itself from a few hours to under thirty minutes. For a quantitative fund whose decisions depend on time-sensitive data, that gap between a signal arriving and a signal being usable was the entire problem worth solving.
The problem. The asset manager sourced near-real-time consumer-spending intelligence from a third-party provider: data drawn from card-purchase activity that is valuable to quantitative portfolio managers precisely because it moves faster than traditional economic indicators. But that speed advantage was being lost in the last mile. Collecting, cleaning and validating the data was a manual process, and by the time it reached portfolio managers it typically arrived several days after release. A feed built to capture near-real-time consumer behaviour was reaching the desk too late to inform the time-sensitive, data-intensive decisions it existed to support. The bottleneck was not the underlying data but everything that happened to it between the provider and the portfolio manager, manual collection, manual cleaning, manual validation, each adding time before the signal could be trusted and used.
The approach. QuantSpark ran a three-step engagement: a data audit, a data-engineering build, and a quality-assurance layer. It started with a data audit, mapping the existing manual workflow end to end to pinpoint exactly where time was being lost and which steps genuinely needed a human versus which could be automated. From there, the data-engineering build combined a Python-based pipeline with cloud infrastructure and automation to replace manual collection and cleaning, removing the repetitive handling steps that had been adding days to the cycle. Critically, that pipeline was built and deployed inside the asset manager's own cloud environment, meeting the firm's security requirements without the data ever needing to leave their controlled infrastructure, a constraint that shapes how this kind of engagement has to be delivered in financial services. The pipeline's output was connected directly into interactive dashboards for portfolio managers, removing the manual hand-off and formatting steps that previously sat between validated data and the people who needed it. Finally, a quality-assurance layer replaced ad hoc manual checking with automated checks and alerts, triggered whenever incoming source data fell outside expected thresholds, so validation became continuous monitoring rather than a separate manual stage bolted onto the end of the process.
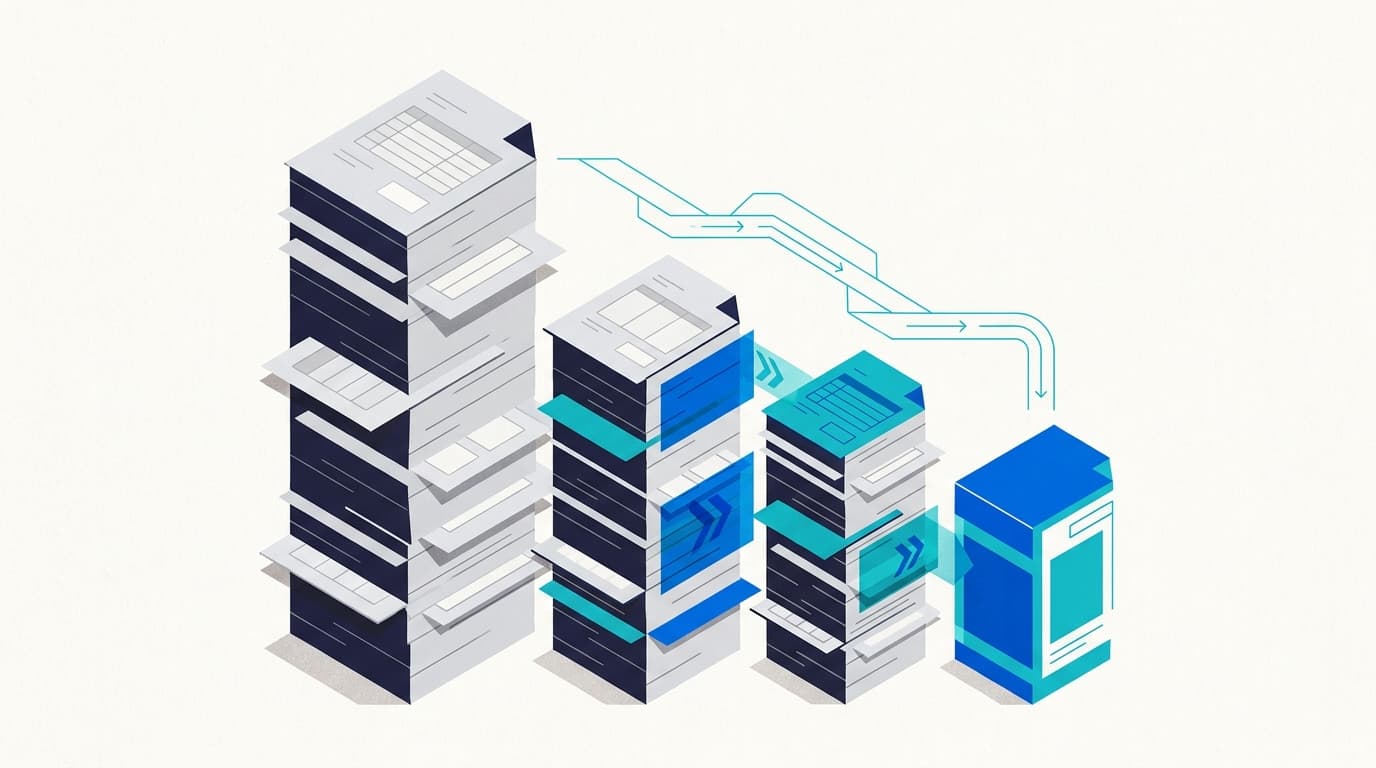
The workflow this produced runs in a straight line: the provider feed arrives, the Python-based cloud pipeline ingests and cleans it in place of manual handling, automated QA checks the data against expected thresholds and flags anomalies before anyone sees it, and the validated output lands directly in the portfolio managers' interactive dashboards. Each stage that used to involve a person passing data to another person, or manually re-checking it before passing it on, is now a monitored, automated step, which is precisely why the total cycle time collapsed rather than merely improving.
The systems underneath it are categorical rather than branded: a Python-based data pipeline for ingestion and transformation, client-hosted cloud infrastructure to satisfy security requirements, an interactive dashboarding layer for delivery, and an automated QA and alerting layer for continuous validation. No specific vendor or product is named in the public record, and none should be inferred.
The value. The headline is a 70% reduction in end-to-end data processing time, from five days to a day and a half. That figure decomposes usefully: the technical processing run itself improved even more sharply, from a few hours to under thirty minutes, isolating pure pipeline efficiency from the human review either side of it. The combined effect freed resource previously spent on manual collection and checking for higher-value work, and let portfolio managers act on consumer-spending signals sooner, closer to the point where the data still carried its intended time advantage. Turning that into a monetary return would need two figures the public record does not include, the analyst hours the manual process used to absorb, and the trading value of a faster signal, so the honest claim stops at time saved and capacity freed rather than a derived pound figure. That restraint is itself part of the story: a technically disciplined engagement, in the client's own environment, measured in the two numbers that actually moved.
Figures are drawn from completed QuantSpark engagements. Clients are anonymised by agreement; on a call we will walk you through how each number was measured and, where the client has agreed, put you in touch with a reference.
This engagement used our Data platform builds practice
Related case studies
An investment management firm
Streamlining Excel-based workflows with Python automation
A global ESG-focused asset manager
Automating a global asset manager's data pipeline to streamline decisions

An asset management firm
Automating performance fee calculations for accuracy and efficiency
Related insights

How AI Coding Assistants are Transforming Software Development: Power, Potential, and Best Practices
AI coding assistants like GitHub Copilot are reshaping software development, enabling faster prototyping and creative problem-solving. While powerful, thoughtful deployment with clear best practices…

The Brunelleschi Lesson: Why Operational AI Demands Both Human Ingenuity and Structural Rigour
Successfully implementing enterprise AI requires a dual focus: engaged human ingenuity and robust data infrastructure. Neglecting either side leads to underperformance, a lesson discernible from historical breakthroughs in art and science.

QuantSpark: Turning AI Ambition into Operational Reality for Private Equity
QuantSpark partners with private equity firms and their portfolio companies to deliver end-to-end AI transformation, combining strategy, AI, and software engineering to build high-ROI applications
Ask about our work
Answers only from our documented case studies
Powered by the same applied-AI approach we deliver for clients
Solving something similar in Financial Services?
Get in touch. We will discuss your challenge and show you what is possible.
Read more on AI for financial services