
Introduction to Analytics for Business Leaders
QuantSpark's plain-English guide to high-impact analytics deployment, and why effective analytics is your value creation strategy. Give us fifteen minutes and we will show you how to lead data initiatives that deliver rapid, measurable return.
The cost of not investing is the real risk
Business leaders rightly judge analytics projects on return on investment. The number few account for is the opportunity cost of standing still: lost customers, mispriced marketing and financial reporting you cannot trust. Data is not an IT line item. It is your value creation strategy.
The gains are distributed across the whole C-suite
Analytics is not one department's tool. Churn and lifetime-value modelling serve the CEO, lead scoring the revenue chief, a single source of truth the CFO, spend optimisation the CMO, and flight-risk prediction the people function. Organisation-wide data cuts through the politics and aligns teams around common goals.
Most data projects fail on culture, not technology
When costs outweigh benefits the cause is rarely technical. IT gets blamed, the board disengages, investment sinks into preparing data rather than using it, and analytics is dismissed as an 'IT thing'. Fixing the culture is a leadership job, not a tooling one.
Prioritise, then build a costed roadmap
Assess your capabilities across people, process, systems and technical maturity. Link every initiative to business strategy, quantify the value, and sequence a costed roadmap over three, six, twelve and twenty-four months. That plan, owned from the top, is what turns intent into measurable return.
Foreword: a blueprint for data science success
This short guide explains data analytics in plain English. It sets out how CEOs and business leaders can lead data initiatives that deliver rapid, measurable return on investment.
Maybe you are a data sceptic, tired of IT projects that overspend and underdeliver. We will seek to convince you that the cost of not investing could be far higher, while showing you practical ways to safeguard the investment.
Give us fifteen minutes of your day and we will explain:
- How data analytics can be used across the organisation to benefit individual departments and the company as a whole.
- Why data projects go wrong and what to do about it.
- How to assess your organisation's data capabilities and chart a path to data maturity.
- How to prioritise initiatives and create a robust delivery roadmap.
- What a good data culture looks like.
- The benefits of bespoke, custom data tools.
Analytics across the organisation
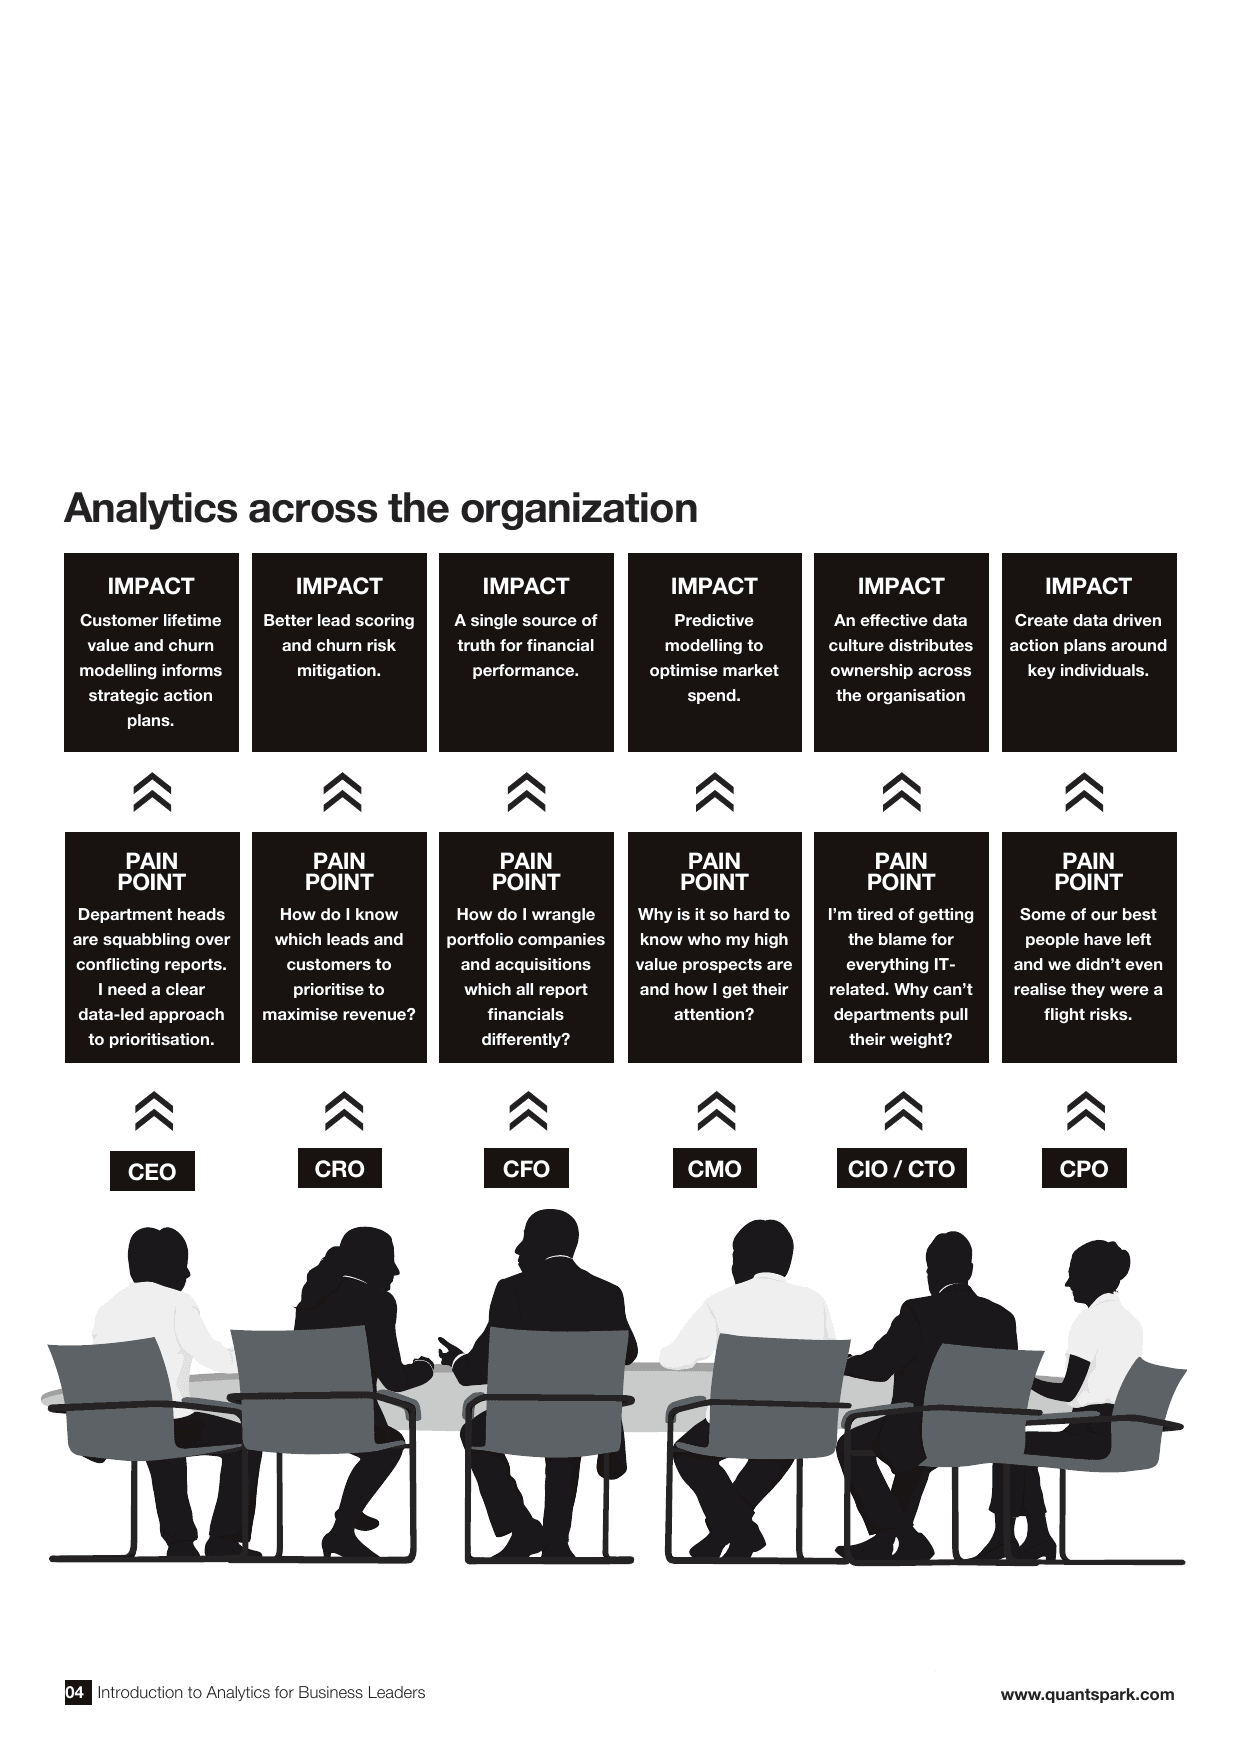
Every seat at the executive table has a data problem, and analytics answers each one.
- CEO. Department heads squabble over conflicting reports and prioritisation is guesswork. Customer lifetime value and churn modelling inform clear, data-led action plans.
- CRO. Which leads and customers should you prioritise to maximise revenue? Better lead scoring and churn-risk mitigation answer both.
- CFO. Portfolio companies and acquisitions all report financials differently. A single source of truth gives one view of performance.
- CMO. Reaching high-value prospects is hard. Predictive modelling optimises market spend against the channels that convert.
- CIO / CTO. Tired of getting the blame for everything IT-related. An effective data culture distributes ownership across the organisation.
- CPO. Your best people leave before you spot the risk. Predictive models raise flags on key-talent flight risk and support data-driven action plans.
Data in numbers: the market at a glance
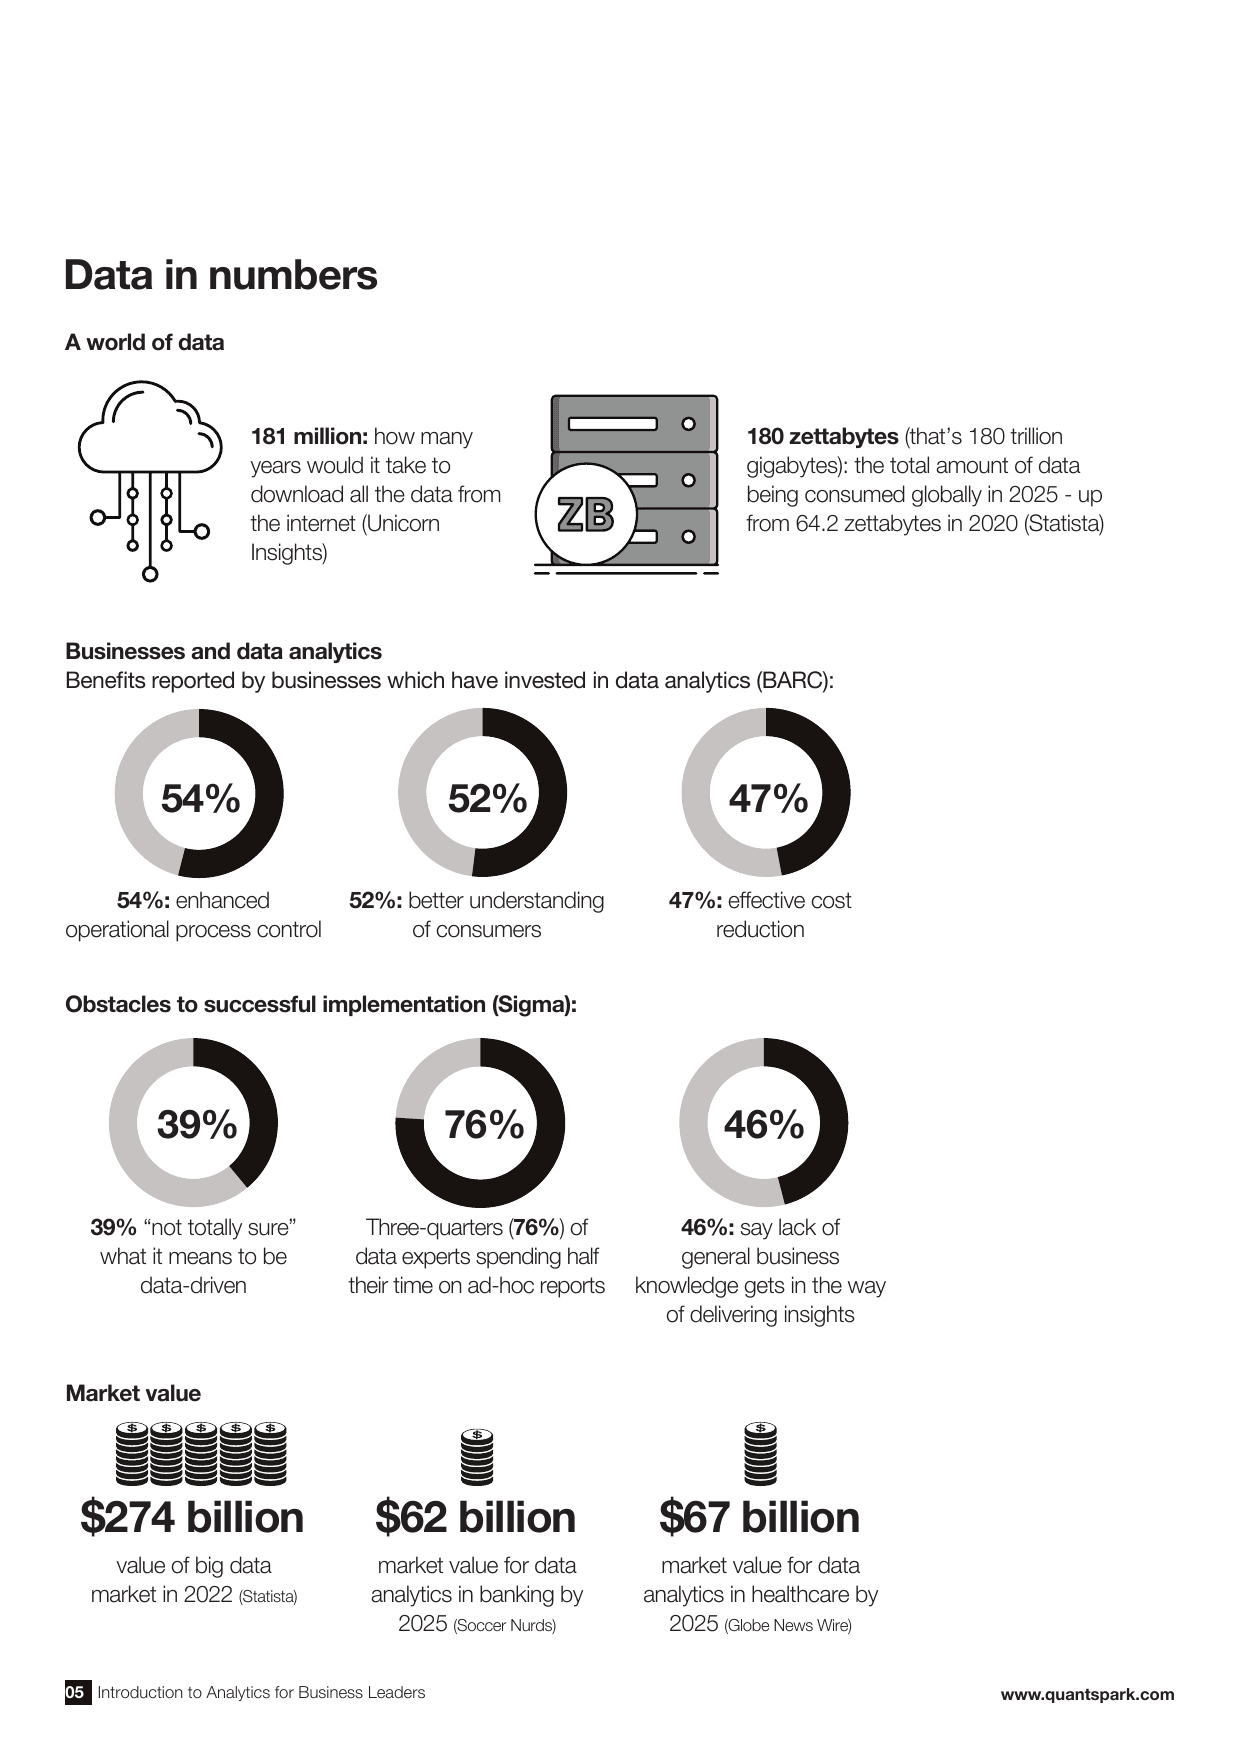
A world of data. It would take 181 million years to download all the data on the internet (Unicorn Insights). The world consumed 180 zettabytes, that is 180 trillion gigabytes, in 2025, up from 64.2 zettabytes in 2020 (Statista).
Businesses are already seeing returns. Among businesses that have invested in data analytics, 54% report enhanced operational process control, 52% a better understanding of consumers and 47% effective cost reduction (BARC).
The obstacles are real, and mostly human. 39% of organisations are not totally sure what it means to be data-driven, three-quarters (76%) of data experts spend half their time on ad-hoc reports, and 46% say a lack of general business knowledge gets in the way of delivering insights (Sigma).
The market is large and growing. The big data market was worth $274 billion in 2022 (Statista). Data analytics in banking is forecast to reach $62 billion, and in healthcare $67 billion, by 2025 (Soccer Nurds; Globe News Wire).
Summary: the argument in one page
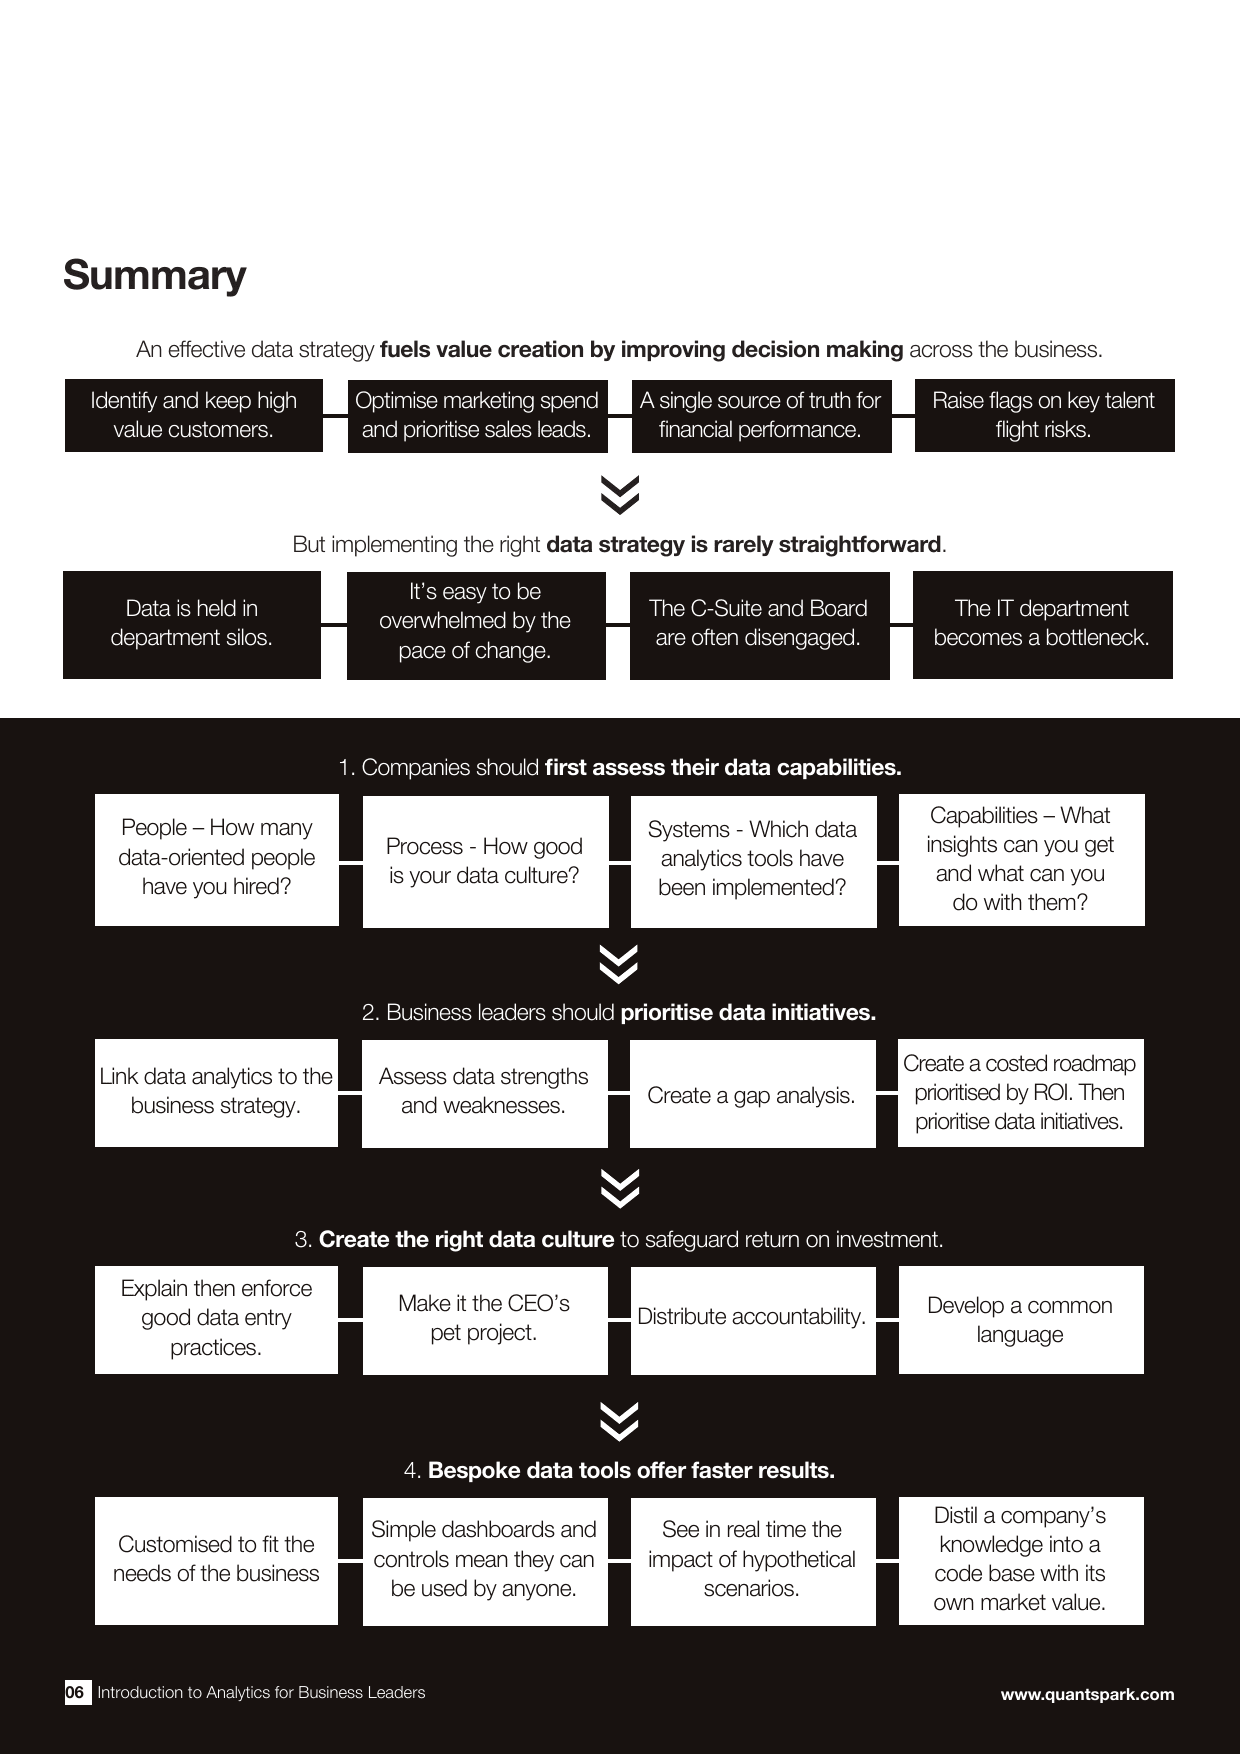
An effective data strategy fuels value creation by improving decision making across the business: identify and keep high-value customers, optimise marketing spend and prioritise sales leads, build a single source of truth for financial performance, and raise flags on key-talent flight risks.
But implementing the right data strategy is rarely straightforward. Data is held in department silos, it is easy to be overwhelmed by the pace of change, the C-suite and board are often disengaged, and the IT department becomes a bottleneck.
The path through has four steps:
- Assess your data capabilities across people, process, systems and the insights you can actually get from them.
- Prioritise data initiatives: link analytics to business strategy, assess strengths and weaknesses, run a gap analysis, and create a costed roadmap prioritised by ROI.
- Create the right data culture to safeguard the return: enforce good data-entry practices, make it the CEO's own project, distribute accountability and develop a common language.
- Use bespoke data tools for faster results: customised to the business, usable by anyone, showing the impact of hypothetical scenarios in real time, and distilling the company's knowledge into valuable intellectual property.
An effective data strategy fuels value creation by improving decision making across the business.
Introduction: data is your value creation strategy
The application of data to problem solving and decision making is the single most important innovation of the last twenty years. Rooted in hard science, it can seem intimidating, but your company's future depends on it.
Data strategy is an existential priority. Just as oil once produced everything from petrol to plastic, applied data science now extracts insight from large volumes of data, across many applications. The share of businesses with a Chief Data Officer has risen to 63%, a fivefold increase since 2012 (Wikibon).
There has never been a better time to create value through data. The volume of available data grows exponentially: internet users generate 2.5 quintillion bytes every day (Data Never Sleeps 5.0). New sources, from social media feeds to satellite imagery, combine with open data on weather and web traffic to produce ever more meaningful insights. Cloud technology has cut the cost of storage and processing, and off-the-shelf packages have lowered the skills barrier to entry.
But value creation through data does not come easy. Business leaders can feel lost in a sea of acronyms and IT-speak, and some analysts struggle to anchor projects in commercial reality, building elegant solutions to the wrong problems. One in four business leaders have given up on getting an answer they needed because the analysis took too long.
Change is hard, but not as hard as the alternative. Many in senior management, stung by IT projects that flattered to deceive, are wary of data initiatives. Yet not investing is not an option. Analytics predicts what customers will want next, which are the highest value and which are likely to churn, where efficiencies can safely be made, how to optimise marketing spend and how to clear up financial reporting. 69% of businesses report improved decision making as a benefit. Put simply, data is your value creation strategy.
Business leaders rightly talk about ROI as the basis for evaluating data analytics projects. But what some don't understand is the opportunity cost of not investing in it.
How data analytics work
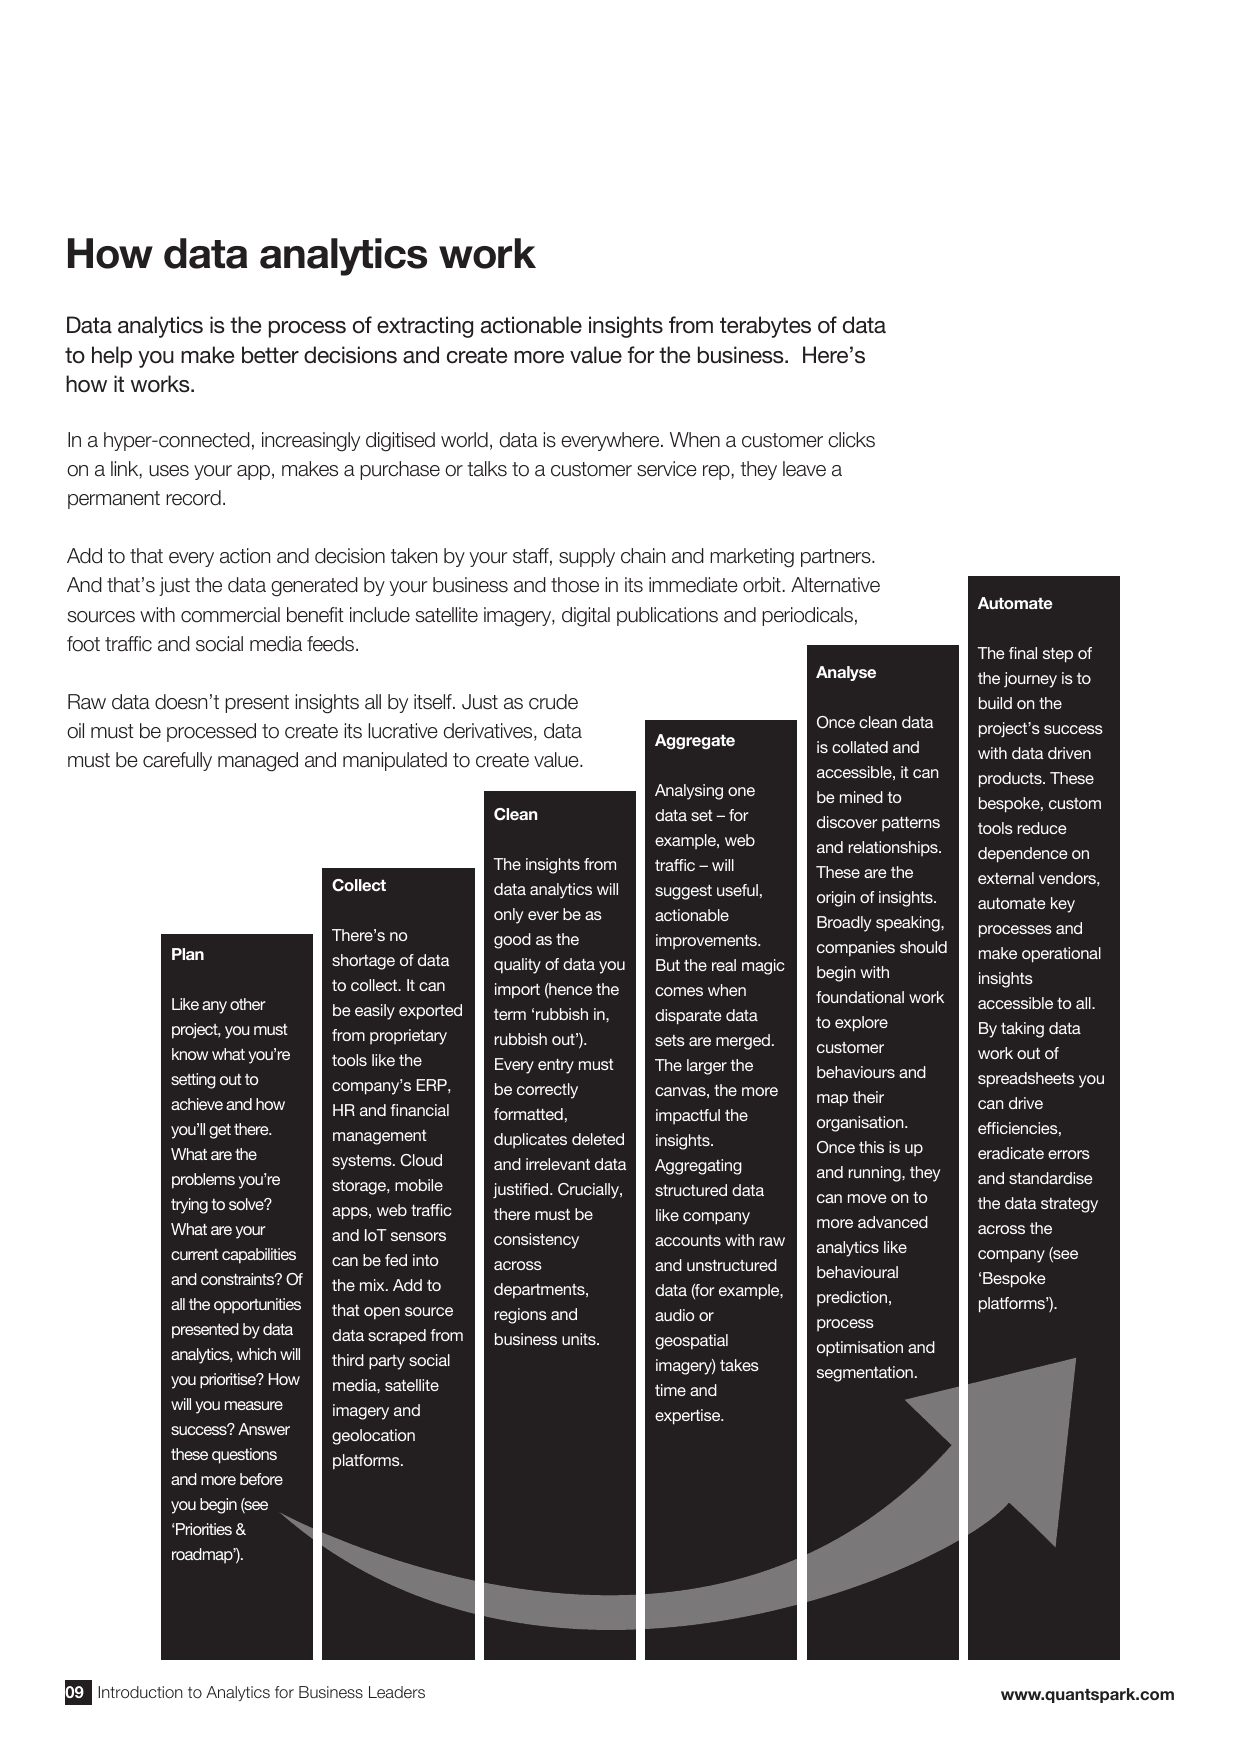
Data analytics is the process of extracting actionable insights from terabytes of data to help you make better decisions and create more value. In a hyper-connected world, data is everywhere: every click, purchase and service call leaves a permanent record, alongside every action taken by staff, supply chain and partners.
Raw data presents no insights by itself. Just as crude oil must be processed to create its lucrative derivatives, data must be carefully managed to create value. The journey runs through six stages:
- Plan. Know what you are setting out to achieve and how you will get there. What problems are you solving? What are your current capabilities and constraints? How will you measure success?
- Collect. Export data from proprietary ERP, HR and financial systems, and add cloud storage, mobile apps, web traffic and IoT sensors, plus third-party sources such as social media, satellite imagery and geolocation.
- Clean. Insights are only ever as good as the data behind them: rubbish in, rubbish out. Every entry must be correctly formatted, duplicates and irrelevant data removed, and consistency enforced across departments and business units.
- Aggregate. The real value comes when disparate data sets are merged. The larger the canvas, the more impactful the insights.
- Analyse. Clean, collated data is mined to discover patterns and relationships. Begin with foundational work on customer behaviours, then move to advanced analytics such as behavioural prediction, process optimisation and segmentation.
- Automate. Build on success with data-driven products: bespoke tools that reduce dependence on external vendors, automate key processes and make operational insights accessible to all.
Just as crude oil must be processed to create its lucrative derivatives, data must be carefully managed and manipulated to create value.
Benefits distributed across every department
Data analytics transforms every department, letting senior executives exploit opportunities, course-correct in real time and plan future scenarios. Here is what that looks like role by role.
- CEO. Silos, poor data quality and contradictory KPIs mean a different answer to every simple question. Churn modelling prioritises high-value customers, lifetime-value modelling names them, data reconciliation gives customer- and product-level views of P&L, and cost-per-acquisition analysis optimises marketing spend.
- CRO. Which leads and customers should you prioritise, and what is the action plan for key accounts? Better lead scoring ranks prospects by a predictive model of lifetime value, and churn-risk mitigation focuses effort on customers who may leave.
- CFO. Highly qualified teams spend too long pulling reports and still lack a granular view of P&L. Analytics provides a single source of truth, sliced by product, business unit or customer, with data collated, cleansed and reconciled automatically, and dashboards that let non-technical staff self-serve.
- CMO. Still making expensive decisions on gut instinct. Predictive models optimise market spend by channel, a data-led approach sharpens segmentation, and basket analysis predicts what customers will buy next.
- CIO / CTO. Tired of the blame for contradictory data and siloed toolsets. An analytics diagnostic produces a costed, prioritised roadmap, data warehouses establish a single point of truth, and an effective data culture distributes ownership.
- CPO. Your best people leave before you realise they are flight risks. Predictive models flag key-talent risk and align headcount planning with the real time it takes to hire, onboard and account for attrition.
Data analytics transforms every department, allowing senior executives to exploit opportunities, course-correct in real time and plan future scenarios.
Data maturity: know where you sit
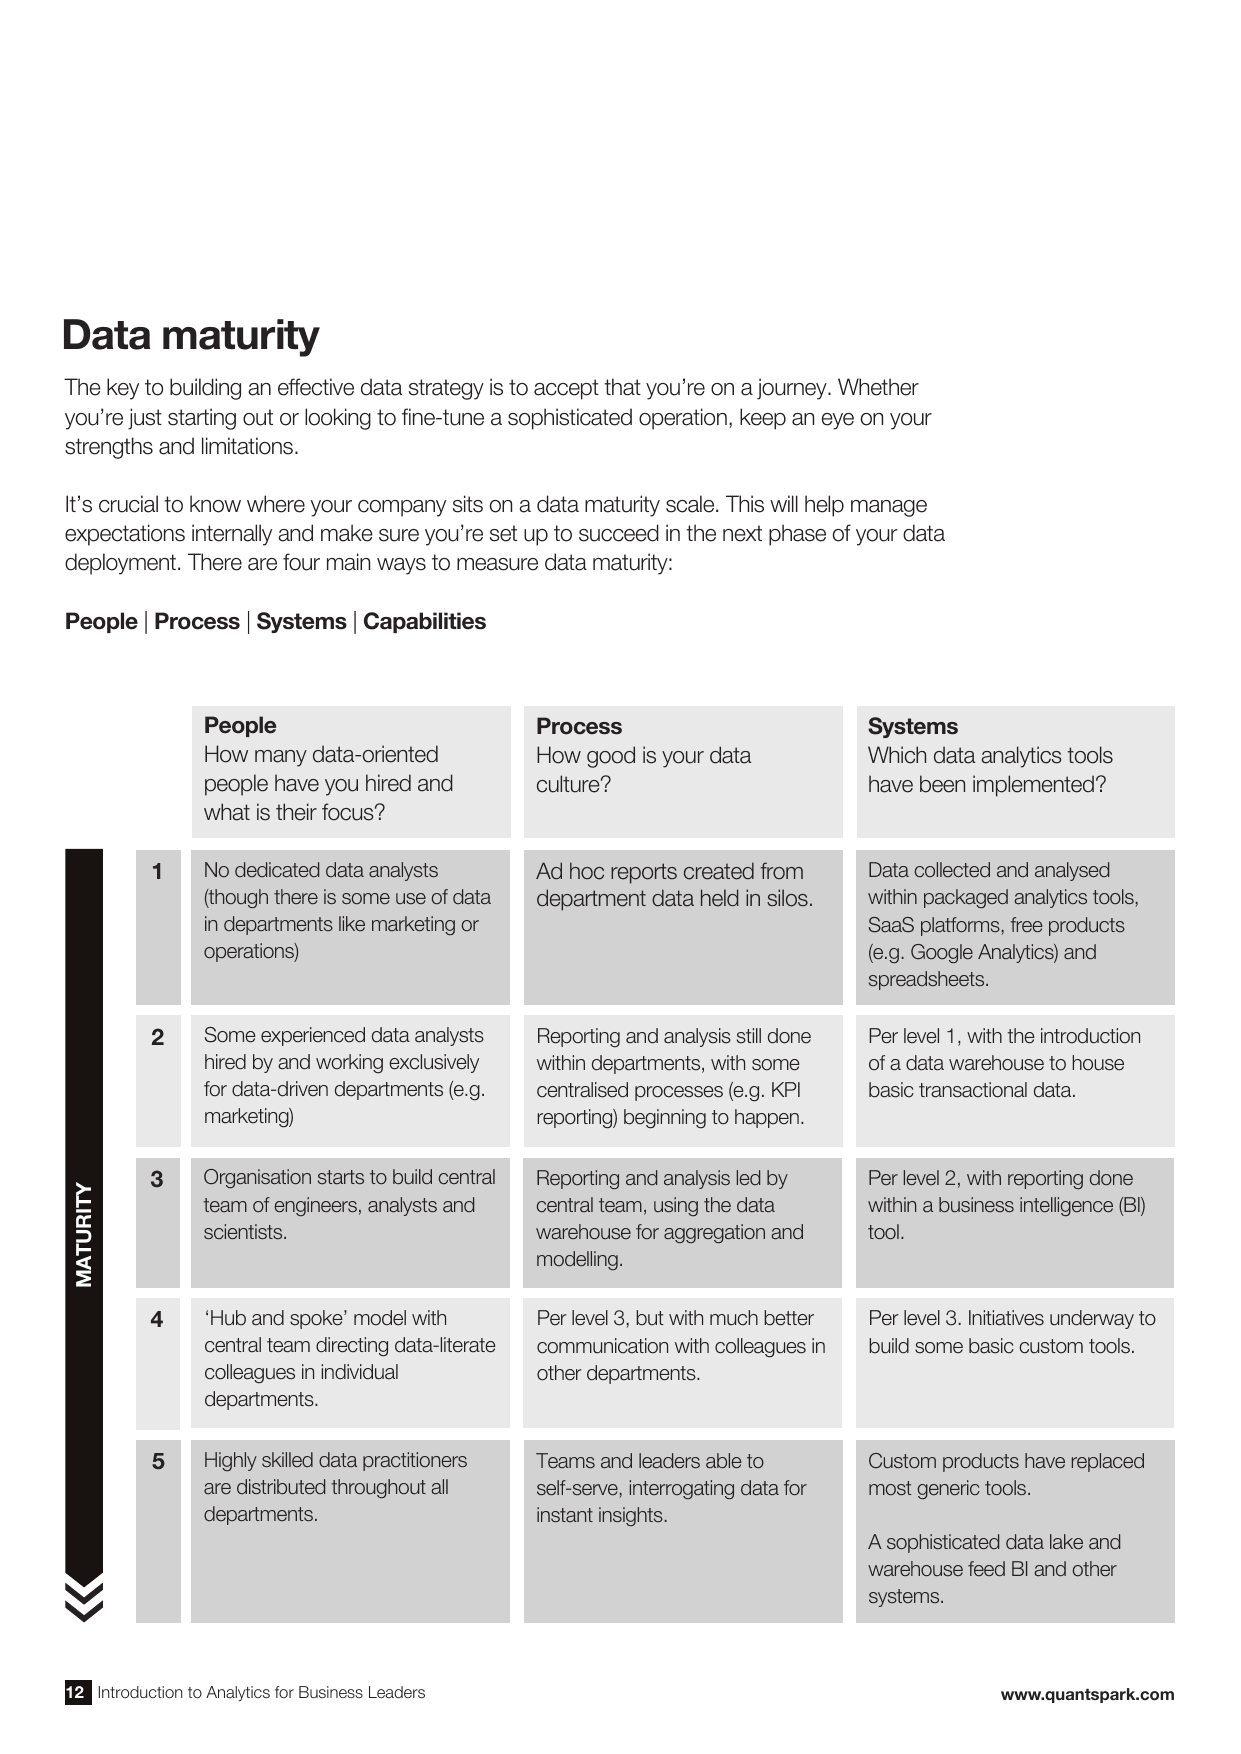
An effective data strategy is continuous, not a one-off project. Whether you are just starting out or fine-tuning a sophisticated operation, keep an eye on your strengths and limitations. Knowing where you sit on a maturity scale manages expectations internally and sets you up for the next phase.
There are four ways to measure data maturity. The first three are scored from one to five:
- People: how many data-oriented people you have hired, and their focus. Level one has no dedicated analysts; level five has skilled practitioners distributed across every department.
- Process: how good your data culture is. Level one is ad-hoc reports from siloed data; level five is teams and leaders self-serving for instant insight.
- Systems: which analytics tools you have implemented. Level one is spreadsheets and free products; at level five, custom products replace most generic tools, fed by a sophisticated data lake and warehouse.
An effective data strategy is continuous, not a one-off project.
Why it matters
Prioritise, then build a costed roadmap
Assess your capabilities across people, process, systems and technical maturity. Link every initiative to business strategy, quantify the value, and sequence a costed roadmap over three, six, twelve and twenty-four months. That plan, owned from the top, is what turns intent into measurable return.
Talk to us about your data strategyCapabilities: the technical maturity pyramid
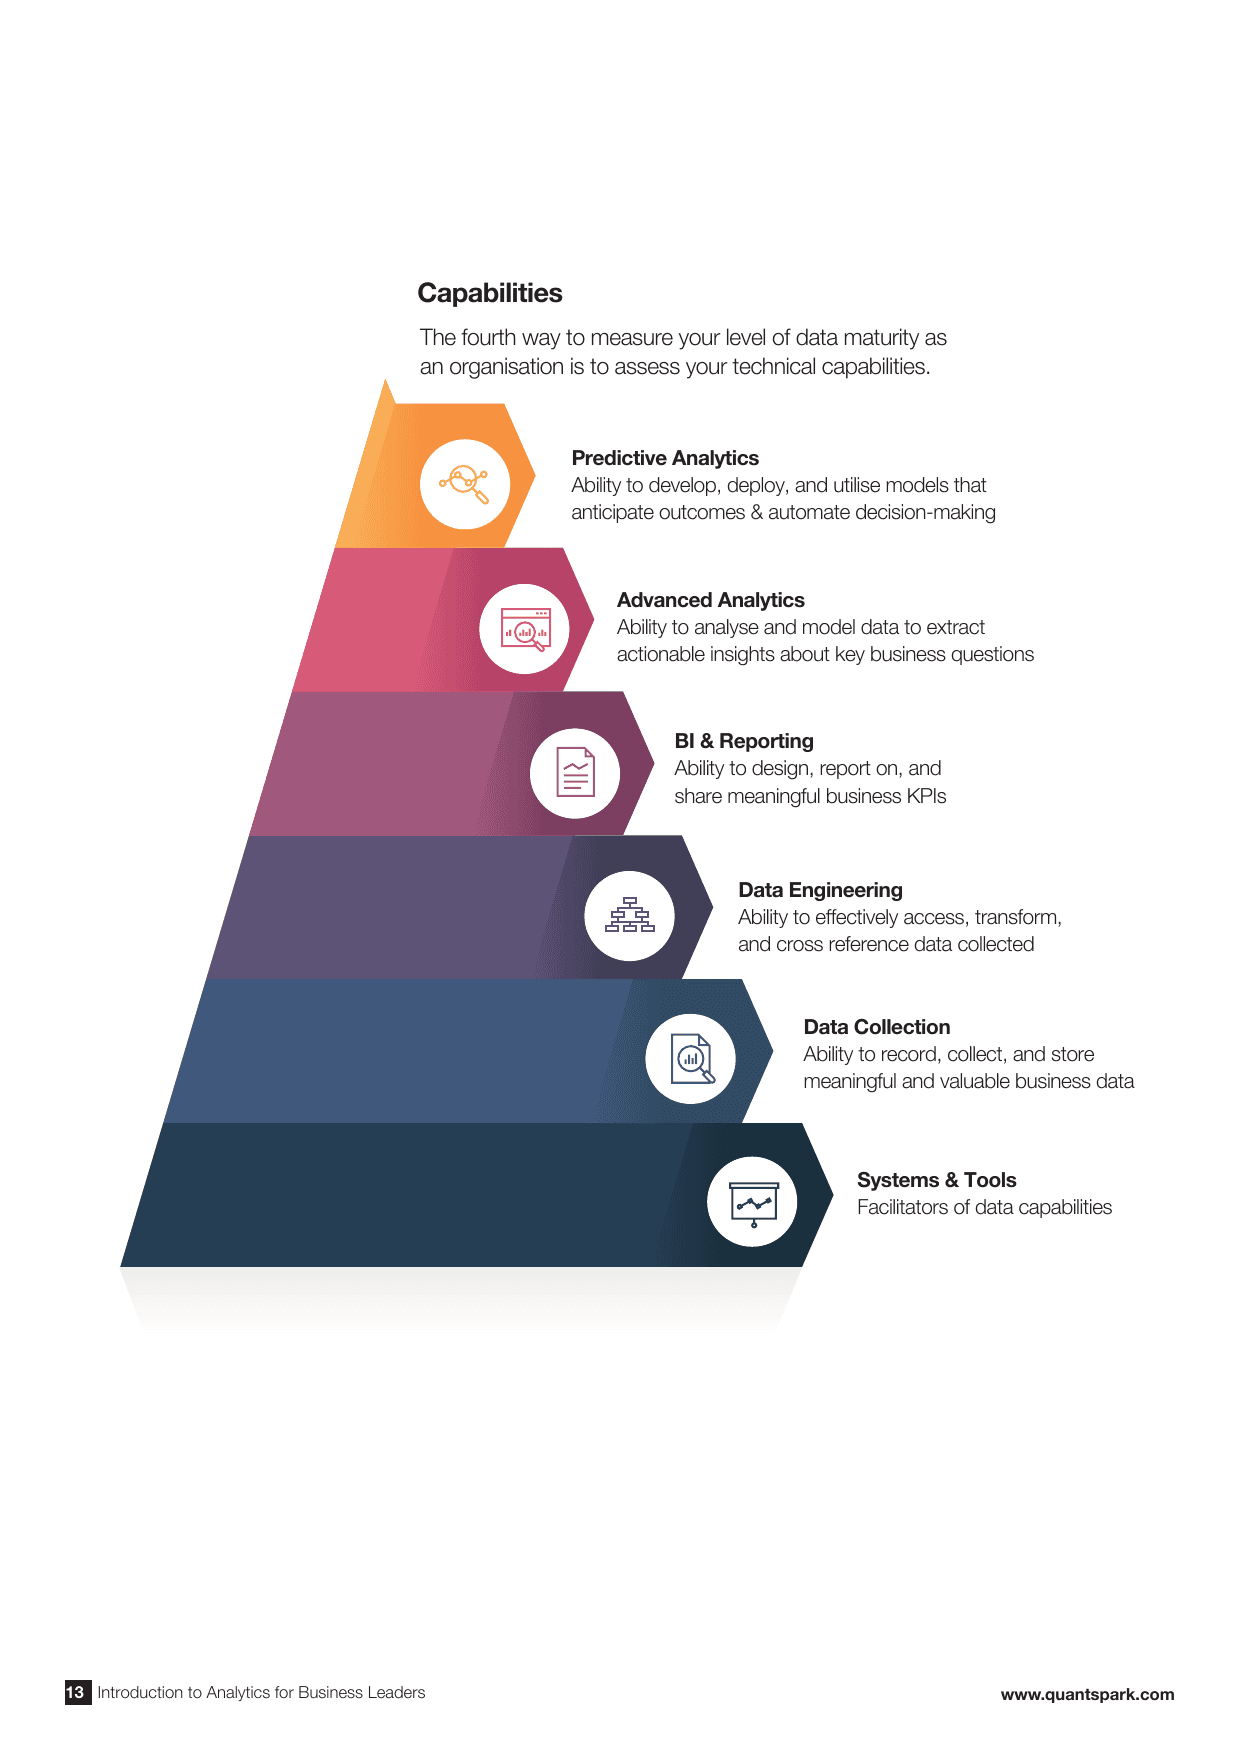
The fourth way to measure maturity is to assess your technical capabilities. They stack into a pyramid, each layer resting on the one below:
- Systems and tools are the facilitators of every data capability.
- Data collection is the ability to record, collect and store meaningful business data.
- Data engineering accesses, transforms and cross-references that data.
- BI and reporting designs and shares meaningful business KPIs.
- Advanced analytics models data to extract actionable insight on key business questions.
- Predictive analytics sits at the top: developing and deploying models that anticipate outcomes and automate decision-making.
You cannot skip a layer. Predictive power at the summit depends on clean collection and sound engineering underneath.
Priorities and roadmap
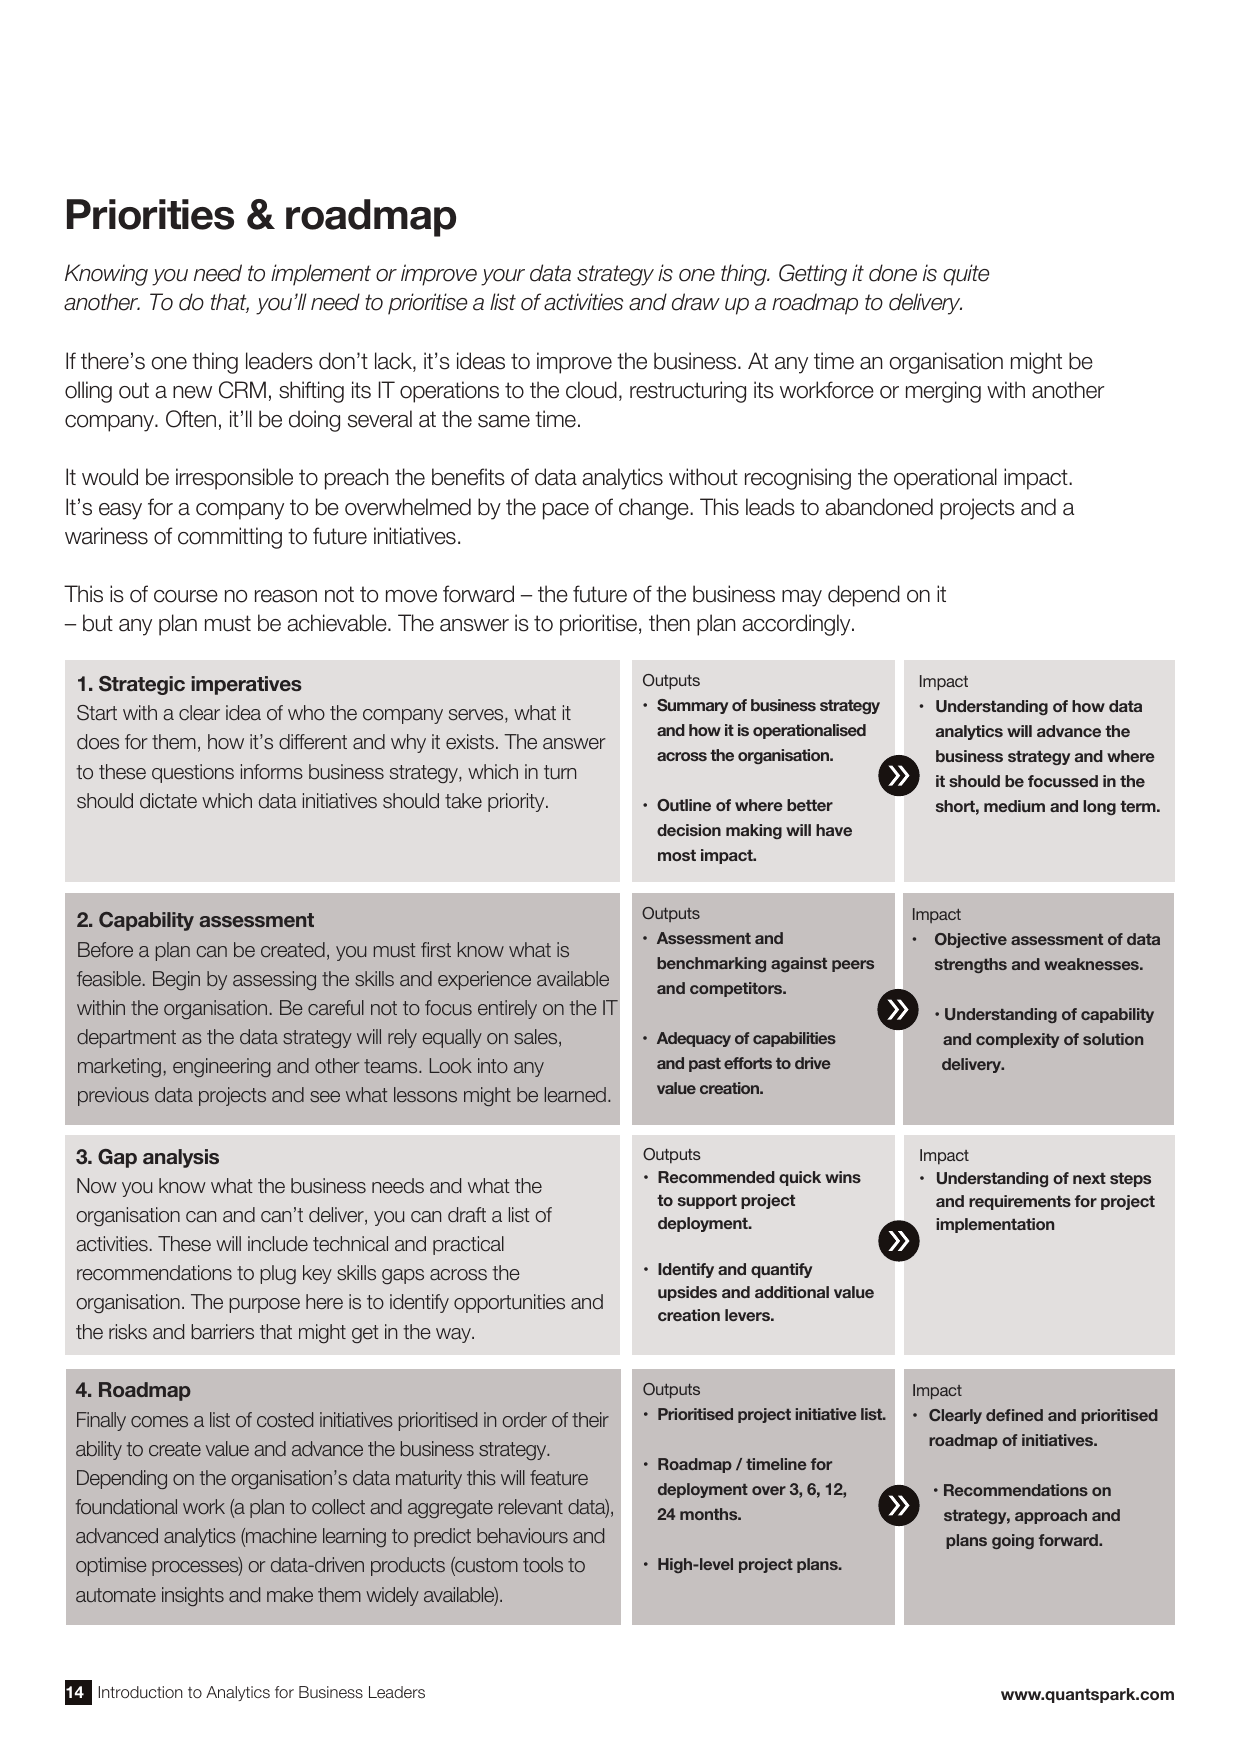
Knowing you need to improve your data strategy is one thing. Getting it done is another. Leaders rarely lack ideas: at any time an organisation might be rolling out a new CRM, shifting IT to the cloud, restructuring or merging. It would be irresponsible to preach the benefits of analytics without recognising that operational load. The answer is to prioritise, then plan accordingly, in four steps:
- Strategic imperatives. Start with a clear idea of who the company serves, what it does for them and why it exists. This informs business strategy, which in turn dictates which data initiatives take priority in the short, medium and long term.
- Capability assessment. Understand what is feasible by assessing the skills and experience available. Look beyond IT: the strategy relies equally on sales, marketing, engineering and other teams. Benchmark against peers and learn from past projects.
- Gap analysis. With the needs and the capabilities known, draft a list of activities, including quick wins and recommendations to plug key skills gaps, and quantify the upsides and the risks.
- Roadmap. Finally, a costed list of initiatives prioritised by their ability to create value, with a timeline over three, six, twelve and twenty-four months and high-level project plans. Depending on maturity this spans foundational work, advanced analytics and data-driven products.
Knowing you need to implement or improve your data strategy is one thing. Getting it done is quite another.
Building the right team
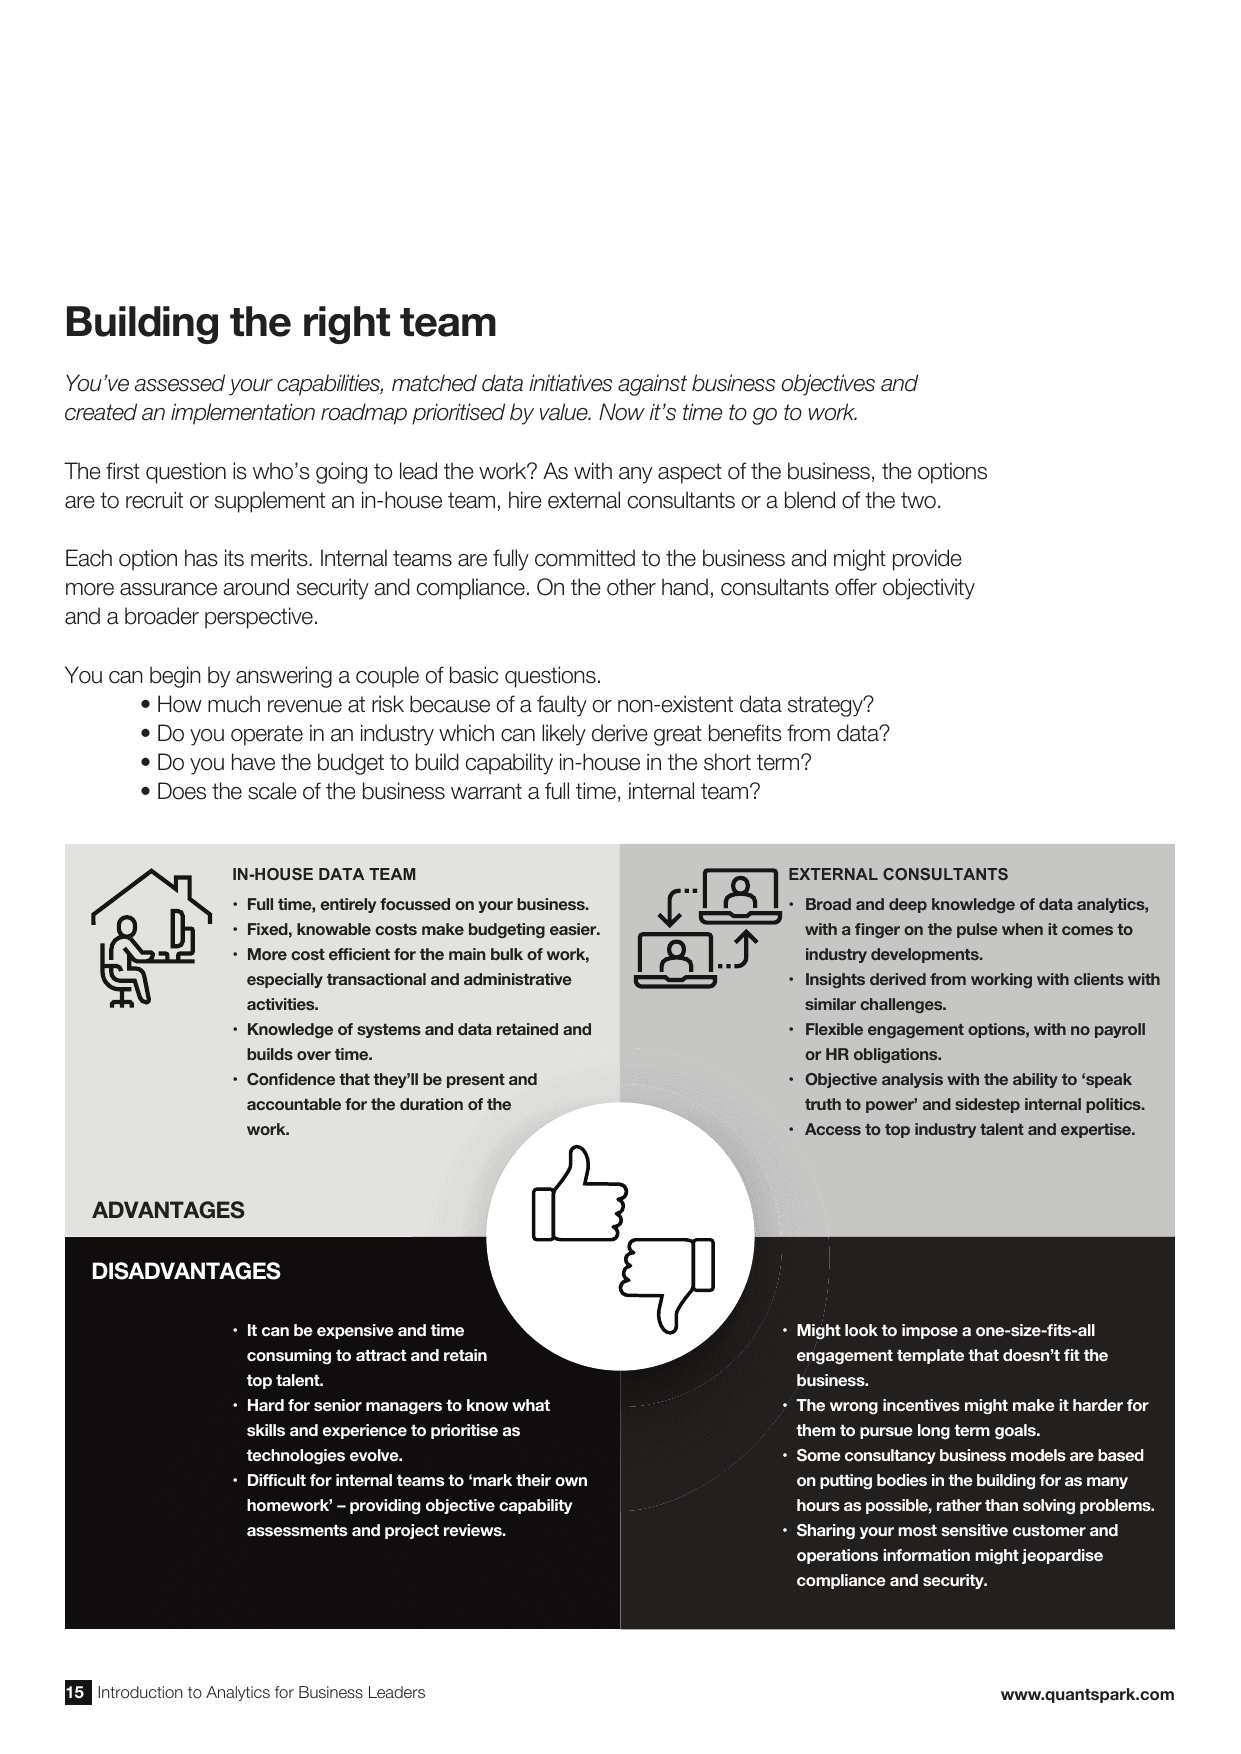
Once you have assessed capabilities, matched initiatives to objectives and built a roadmap, the first question is who leads the work: an in-house team, external consultants, or a blend of the two. Start with a few basic questions. How much revenue is at risk from a faulty or non-existent data strategy? Does your industry stand to gain a lot from data? Do you have the budget to build capability in-house in the short term? Does the scale of the business warrant a full-time internal team?
In-house teams are fully focused on the business, offer more predictable costs, retain knowledge over time and are accountable for the duration. The trade-offs: top talent is expensive and time-consuming to attract and retain, it is hard for senior managers to know which evolving skills to prioritise, and internal teams find it difficult to mark their own homework.
External consultants bring broad, current knowledge, insight from similar challenges elsewhere, flexible engagement with no payroll or HR overhead, the objectivity to speak truth to power and sidestep internal politics, and access to top talent. The trade-offs: a one-size-fits-all template may not fit, some models bill hours rather than solve problems, and sharing sensitive information carries compliance and security risk.
Creating the right data culture
Too many companies see mixed results from analytics, and the overriding problem is usually not technical, administrative or a lack of skills. It is cultural.
How to recognise a bad data culture. When the costs of initiatives outweigh the benefits, look for the symptoms: IT is blamed for poor implementation while operational teams are blamed for useless data; the C-suite and board are disengaged, with expectations resting solely on the CIO or CTO; most of the investment is sunk into preparing data rather than using it; and data is seen as an 'IT thing'.
Working towards a positive data culture. Some fixes are process-driven, others need behavioural change, and all belong high on a leader's task list:
- Explain then enforce good data-entry practices. Poor entry leads to patchy, inconsistent data: rubbish in, rubbish out. Agree the rules and hold people to them.
- Make it the CEO's own project. Why would a junior sales exec capture data diligently if the CEO will not? Behavioural change must be led from the top.
- Distribute accountability. The benefits accrue to all, so the work should be decentralised, with a data advocate in every team.
- Develop a common language. Bridge the gap between IT and the rest of the business by agreeing a shared set of definitions and terms.
- Prioritise and fast-track opportunities. Nothing enthuses a team like results. A series of two-to-four-week sprints proves what data science can do.
Often, the problem isn't technical, nor administrative, nor a lack of skills (though these often come into it). The overriding problem is in fact cultural.
Building bespoke platforms
Bespoke data tools are more powerful than data warehouses, with faster results, and they democratise analysis across the business. Many companies ingest spreadsheet data into a warehouse for more sophisticated analysis, but that step brings new challenges: warehouses are complicated, inaccessible to the casual user, and must be run by experienced data scientists fluent in SQL and Python. The result is a bottleneck, with senior execs clamouring for answers from an overworked team.
Simple questions are more complicated than they look. A CEO asks whether the business is winning more customers than it is losing. The data scientist must first make assumptions: what is a customer, how do we define churn, what if they returned a week later for a different product? Each assumption becomes a script, each script takes time to write, and each output must be validated. Two weeks later there is still no definitive answer, and a black mark is left against a demoralised team.
A proprietary platform for long-term gain. Custom tools are built for the unique needs of a business and can be used by anyone: simple dashboards let those with the right credentials find insights in minutes, and the assumption scripts that cause such headaches are baked into the design, so execs can change variables on the fly and see the impact in real time. Imagine the complexity of an oil tanker managed with the simplicity of a Tesla. Beyond simplicity, the benefits compound:
- Scope and context. Proprietary data can be complemented by open-source data sets for pinpoint insight on a much wider canvas: real-time satellite tracking, social-media sentiment, computer vision or search patterns.
- Speed and scale. Run hundreds of scenarios and map thousands of configurations in minutes. Model what would happen if you reduced headcount or acquired a business.
- No more errors. Bespoke platforms are as reliable as they are fast: a single source of truth, with no sleep-deprived analyst keying in flawed formulae.
- Monetisable intellectual property. The platform distils a company's knowledge into a code base that is reproducible, extendable and valuable.
Imagine the complexity of an oil tanker managed with the simplicity of a Tesla.
Glossary
- Advanced analytics: machine learning, advanced statistics and operations research modelling to support behavioural prediction, process optimisation, recommendation and segmentation.
- Algorithm: a set of instructions that teaches a computer to solve a specific problem.
- Machine learning: the creation of algorithms to model a system based on historical data.
- Data: facts, statistics or pieces of information, usually in the form of a number.
- Data analytics: systemic analysis of data to discover, interpret and communicate meaningful patterns, normally to improve decision making based on historical and predictive insights.
- Data engineering: an architectural approach to plan, analyse, design and implement data analytics.
- Data lake: a place to store data in its raw, unstructured state.
- Data products: bespoke analytics platforms tailored to the needs of an individual business.
- Data science: the use of scientific techniques, processes and systems to extract insights from structured or unstructured data.
- Data warehouse: a central repository of data from one or more sources, where data can be merged and cleansed for analysis.
- Foundational analytics: data architecture, data transformation logic and visualisation analytics to provide actionable insight.
- Open source: data that is freely available for anyone to use or republish.
- Predictive modelling: the development of statistical models to predict future events.
Prefer to read offline?
Download the full white paper (PDF)